

Industrial conglomerate Crane (NYSE: CR) announced better-than-expected revenue in Q4 CY2025, with sales up 6.8% year on year to $581 million. Its non-GAAP profit of $1.53 per share was 8.2% above analysts’ consensus estimates.
Is now the time to buy Crane? Find out by accessing our full research report, it’s free.
Crane (CR) Q4 CY2025 Highlights:
- Revenue: $581 million vs analyst estimates of $570 million (6.8% year-on-year growth, 1.9% beat)
- Adjusted EPS: $1.53 vs analyst estimates of $1.41 (8.2% beat)
- Adjusted EBITDA: $124 million vs analyst estimates of $120.3 million (21.3% margin, 3.1% beat)
- Adjusted EPS guidance for the upcoming financial year 2026 is $6.65 at the midpoint, in line with analyst estimates
- Operating Margin: 17.5%, up from 15.8% in the same quarter last year
- Free Cash Flow Margin: 33.7%, similar to the same quarter last year
- Organic Revenue rose 5.4% year on year (beat)
- Market Capitalization: $11.76 billion
Company Overview
Based in Connecticut, Crane (NYSE: CR) is a diversified manufacturer of engineered industrial products, including fluid handling, and aerospace technologies.
Revenue Growth
Examining a company’s long-term performance can provide clues about its quality. Any business can put up a good quarter or two, but the best consistently grow over the long haul. Crane struggled to consistently generate demand over the last five years as its sales dropped at a 3.9% annual rate. This wasn’t a great result and is a poor baseline for our analysis.
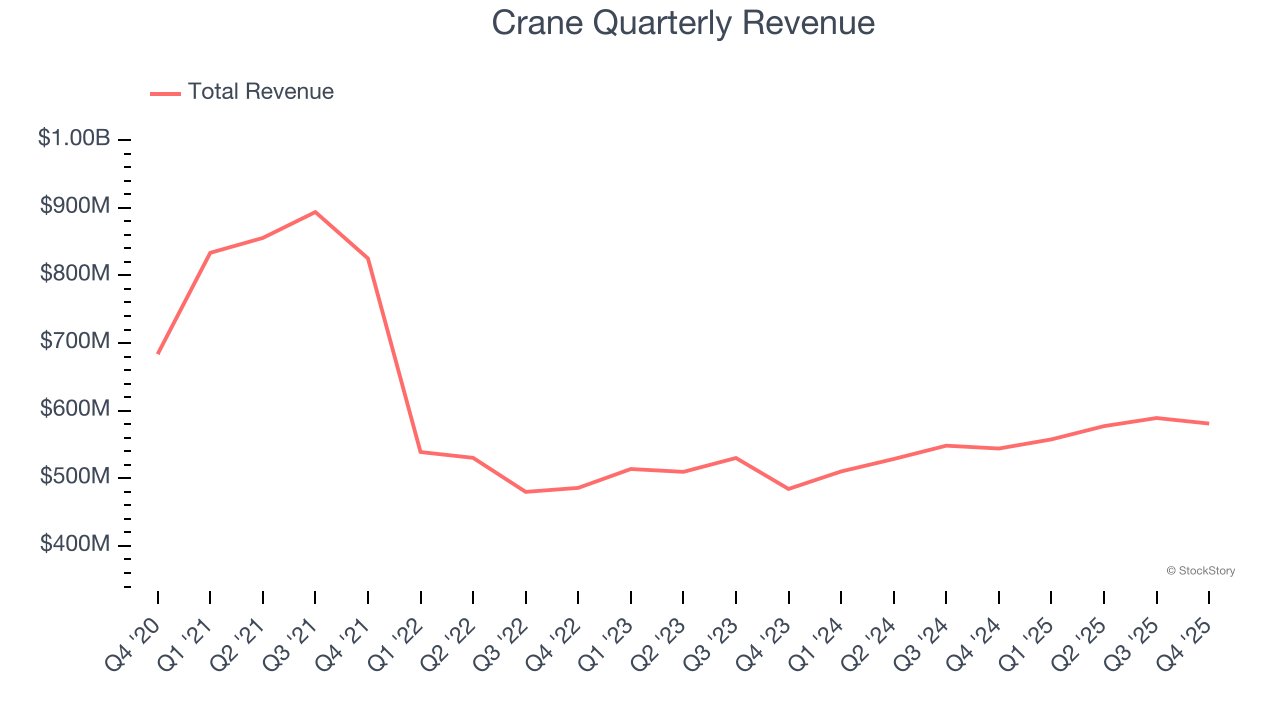
Long-term growth is the most important, but within industrials, a half-decade historical view may miss new industry trends or demand cycles. Crane’s annualized revenue growth of 6.4% over the last two years is above its five-year trend, but we were still disappointed by the results. 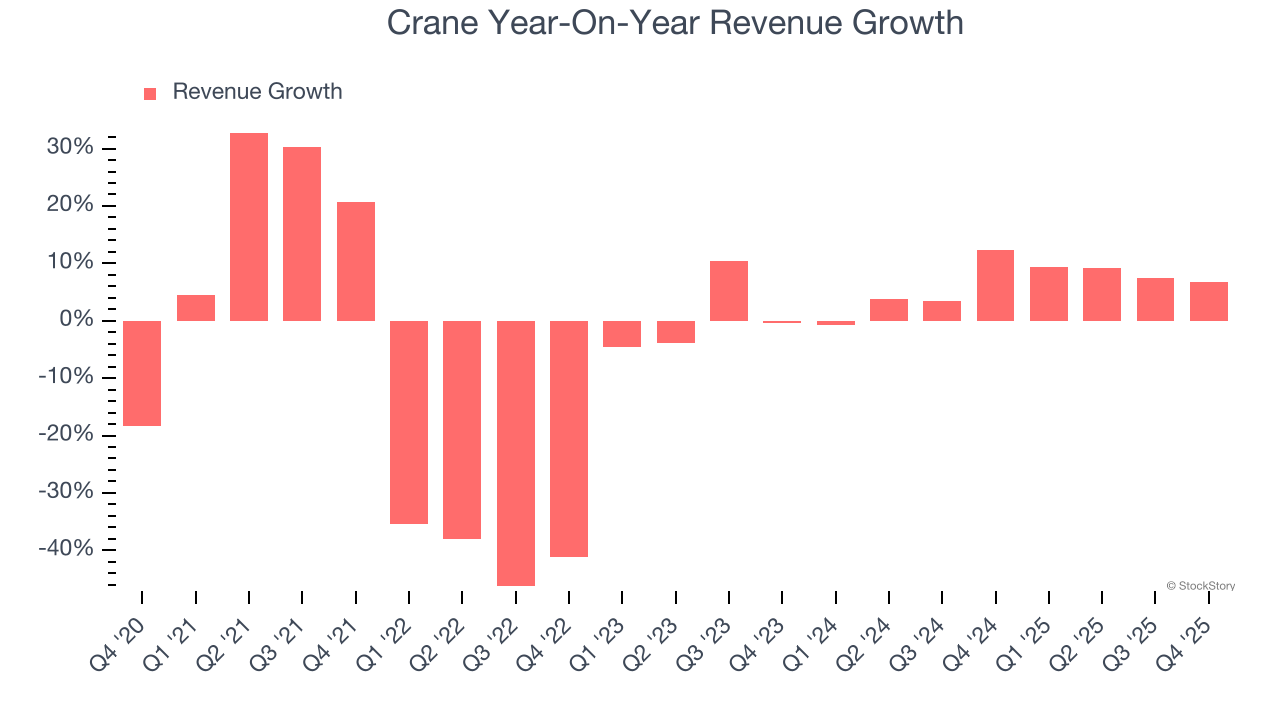
We can better understand the company’s sales dynamics by analyzing its organic revenue, which strips out one-time events like acquisitions and currency fluctuations that don’t accurately reflect its fundamentals. Over the last two years, Crane’s organic revenue averaged 6.6% year-on-year growth. Because this number aligns with its two-year revenue growth, we can see the company’s core operations (not acquisitions and divestitures) drove most of its results. 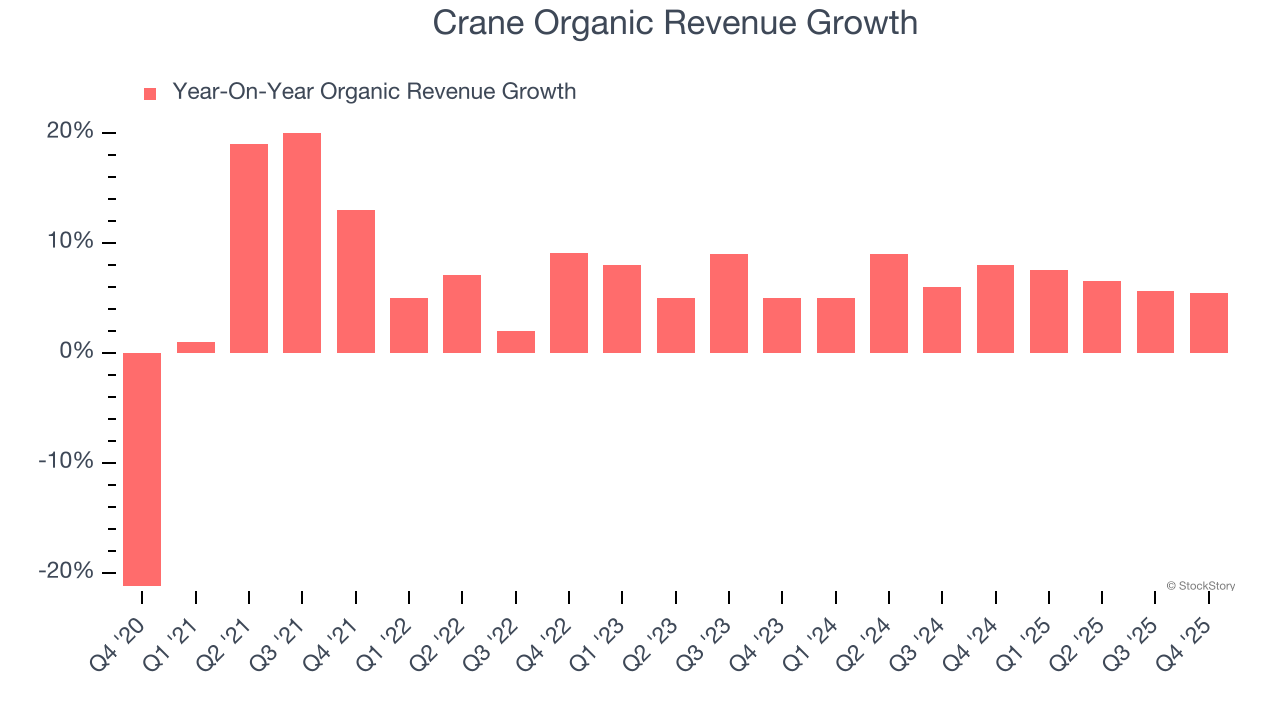
This quarter, Crane reported year-on-year revenue growth of 6.8%, and its $581 million of revenue exceeded Wall Street’s estimates by 1.9%.
Looking ahead, sell-side analysts expect revenue to grow 16.3% over the next 12 months, an improvement versus the last two years. This projection is eye-popping and implies its newer products and services will spur better top-line performance.
The 1999 book Gorilla Game predicted Microsoft and Apple would dominate tech before it happened. Its thesis? Identify the platform winners early. Today, enterprise software companies embedding generative AI are becoming the new gorillas. a profitable, fast-growing enterprise software stock that is already riding the automation wave and looking to catch the generative AI next.
Operating Margin
Operating margin is an important measure of profitability as it shows the portion of revenue left after accounting for all core expenses – everything from the cost of goods sold to advertising and wages. It’s also useful for comparing profitability across companies with different levels of debt and tax rates because it excludes interest and taxes.
Crane has been an efficient company over the last five years. It was one of the more profitable businesses in the industrials sector, boasting an average operating margin of 13.7%. This result isn’t surprising as its high gross margin gives it a favorable starting point.
Looking at the trend in its profitability, Crane’s operating margin rose by 3.1 percentage points over the last five years, showing its efficiency has improved.
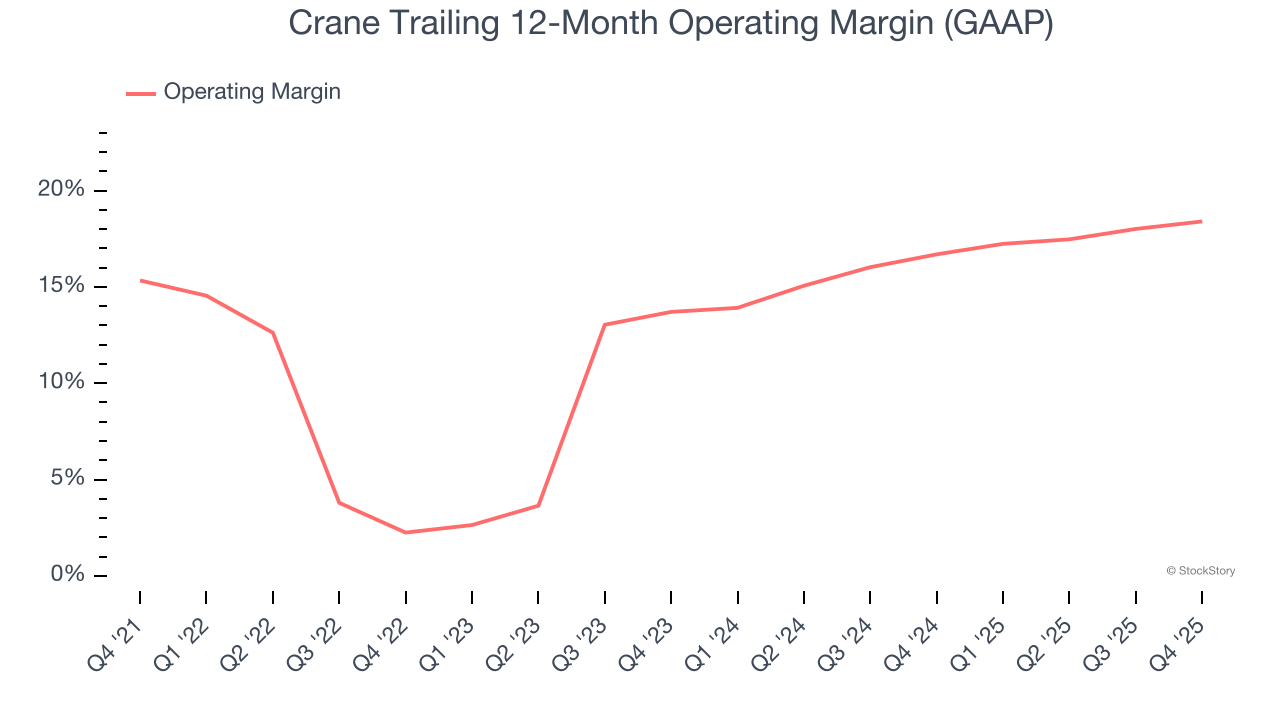
This quarter, Crane generated an operating margin profit margin of 17.5%, up 1.7 percentage points year on year. The increase was encouraging, and because its operating margin rose more than its gross margin, we can infer it was more efficient with expenses such as marketing, R&D, and administrative overhead.
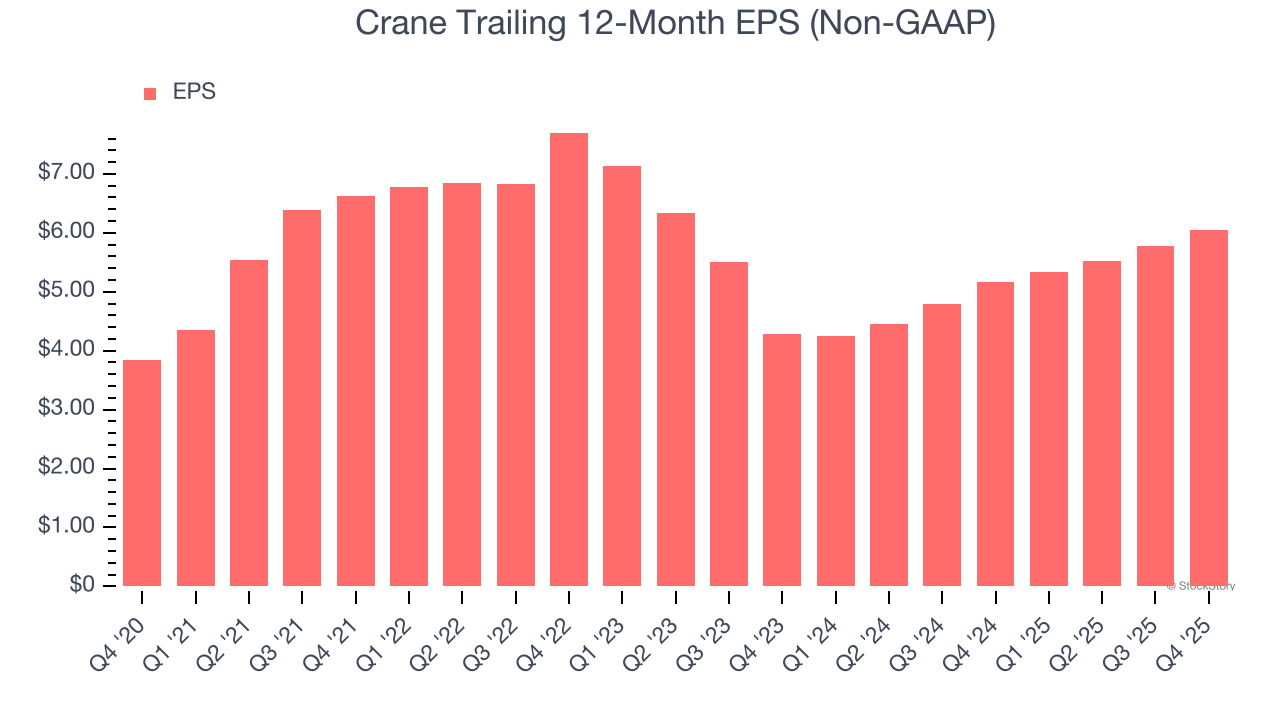
Earnings Per Share
Revenue trends explain a company’s historical growth, but the long-term change in earnings per share (EPS) points to the profitability of that growth – for example, a company could inflate its sales through excessive spending on advertising and promotions.
Crane’s EPS grew at a decent 9.5% compounded annual growth rate over the last five years, higher than its 3.9% annualized revenue declines. This tells us management adapted its cost structure in response to a challenging demand environment.
We can take a deeper look into Crane’s earnings to better understand the drivers of its performance. As we mentioned earlier, Crane’s operating margin expanded by 3.1 percentage points over the last five years. This was the most relevant factor (aside from the revenue impact) behind its higher earnings; interest expenses and taxes can also affect EPS but don’t tell us as much about a company’s fundamentals.
Like with revenue, we analyze EPS over a shorter period to see if we are missing a change in the business.
For Crane, its two-year annual EPS growth of 18.9% was higher than its five-year trend. This acceleration made it one of the faster-growing industrials companies in recent history.
In Q4, Crane reported adjusted EPS of $1.53, up from $1.26 in the same quarter last year. This print beat analysts’ estimates by 8.2%. Over the next 12 months, Wall Street expects Crane’s full-year EPS of $6.05 to grow 8.1%.
Key Takeaways from Crane’s Q4 Results
We enjoyed seeing Crane beat analysts’ organic revenue expectations this quarter. We were also glad its revenue outperformed Wall Street’s estimates. Overall, we think this was a solid quarter with some key areas of upside. The stock remained flat at $210.25 immediately after reporting.
Indeed, Crane had a rock-solid quarterly earnings result, but is this stock a good investment here? When making that decision, it’s important to consider its valuation, business qualities, as well as what has happened in the latest quarter. We cover that in our actionable full research report which you can read here (it’s free).


