

Medical technology company Hologic (NASDAQ: HOLX) reported Q2 CY2025 results topping the market’s revenue expectations, with sales up 1.2% year on year to $1.02 billion. The company expects next quarter’s revenue to be around $1.04 billion, close to analysts’ estimates. Its non-GAAP profit of $1.08 per share was 2.7% above analysts’ consensus estimates.
Is now the time to buy Hologic? Find out by accessing our full research report, it’s free.
Hologic (HOLX) Q2 CY2025 Highlights:
- Revenue: $1.02 billion vs analyst estimates of $1.01 billion (1.2% year-on-year growth, 1.7% beat)
- Adjusted EPS: $1.08 vs analyst estimates of $1.05 (2.7% beat)
- Adjusted EBITDA: $340.9 million vs analyst estimates of $336.4 million (33.3% margin, 1.3% beat)
- Revenue Guidance for Q3 CY2025 is $1.04 billion at the midpoint, roughly in line with what analysts were expecting
- Management raised its full-year Adjusted EPS guidance to $4.25 at the midpoint, a 1.1% increase
- Operating Margin: 24.9%, in line with the same quarter last year
- Free Cash Flow Margin: 32.3%, down from 36.8% in the same quarter last year
- Constant Currency Revenue was flat year on year (3.1% in the same quarter last year)
- Market Capitalization: $14.72 billion
“We are pleased to have delivered revenue and non-GAAP earnings growth in the third quarter that exceeded our guidance ranges,” said Stephen P. MacMillan, the Company’s Chairman, President and Chief Executive Officer.
Company Overview
As a pioneer in 3D mammography technology that has revolutionized breast cancer detection, Hologic (NASDAQ: HOLX) develops and manufactures diagnostic products, medical imaging systems, and surgical devices focused primarily on women's health and wellness.
Revenue Growth
A company’s long-term sales performance is one signal of its overall quality. Any business can put up a good quarter or two, but many enduring ones grow for years. Regrettably, Hologic’s sales grew at a mediocre 4.2% compounded annual growth rate over the last five years. This fell short of our benchmark for the healthcare sector and is a poor baseline for our analysis.
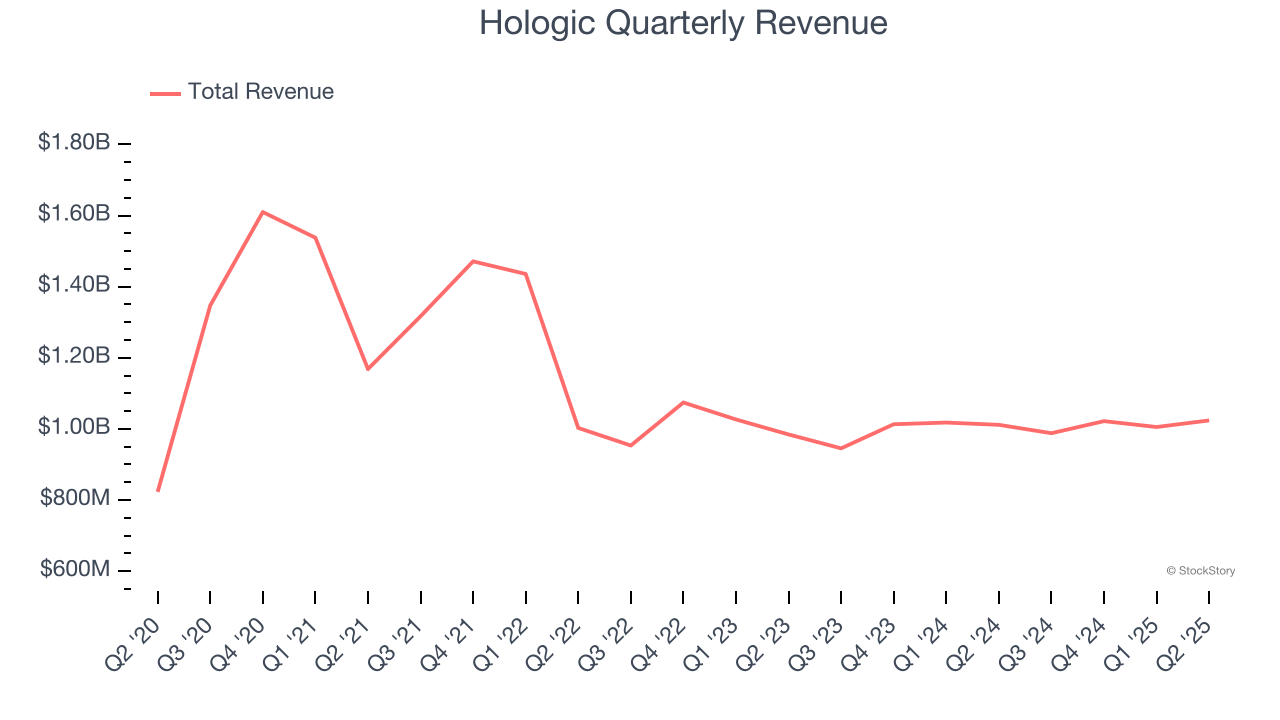
Long-term growth is the most important, but within healthcare, a half-decade historical view may miss new innovations or demand cycles. Hologic’s recent performance shows its demand has slowed as its revenue was flat over the last two years. 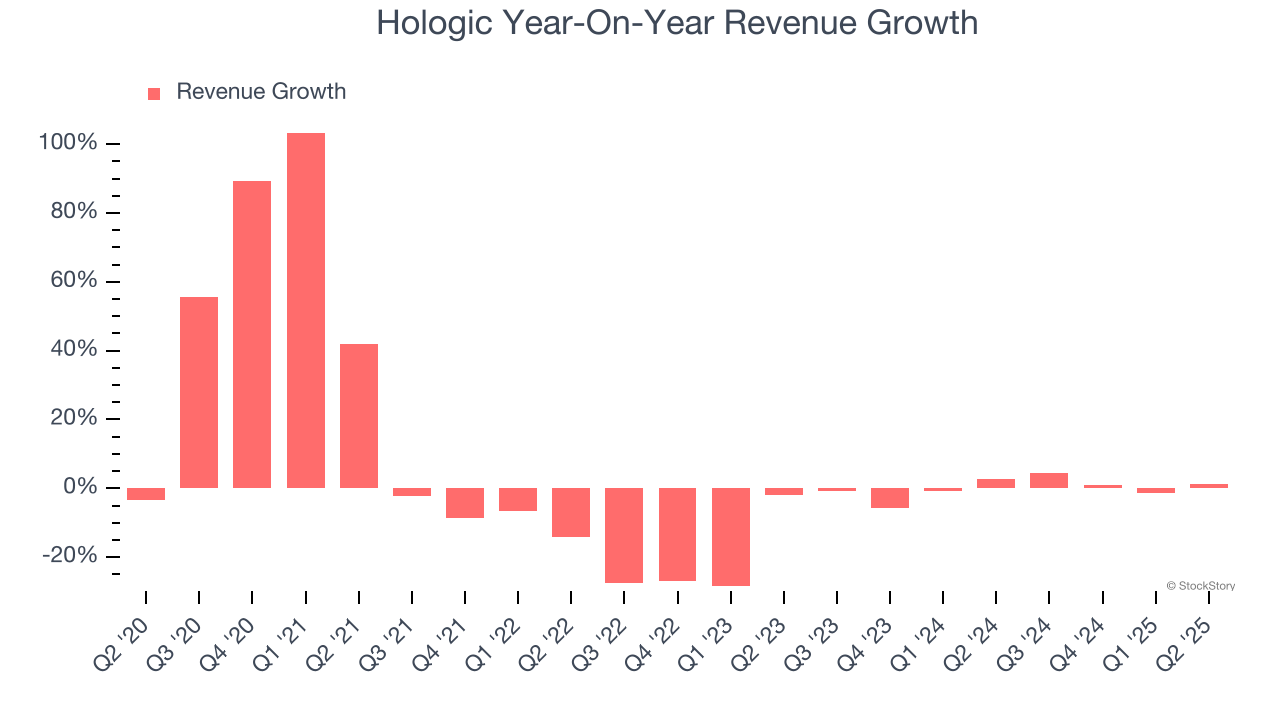
We can dig further into the company’s sales dynamics by analyzing its constant currency revenue, which excludes currency movements that are outside their control and not indicative of demand. Over the last two years, its constant currency sales were flat. Because this number aligns with its normal revenue growth, we can see that Hologic has properly hedged its foreign currency exposure. 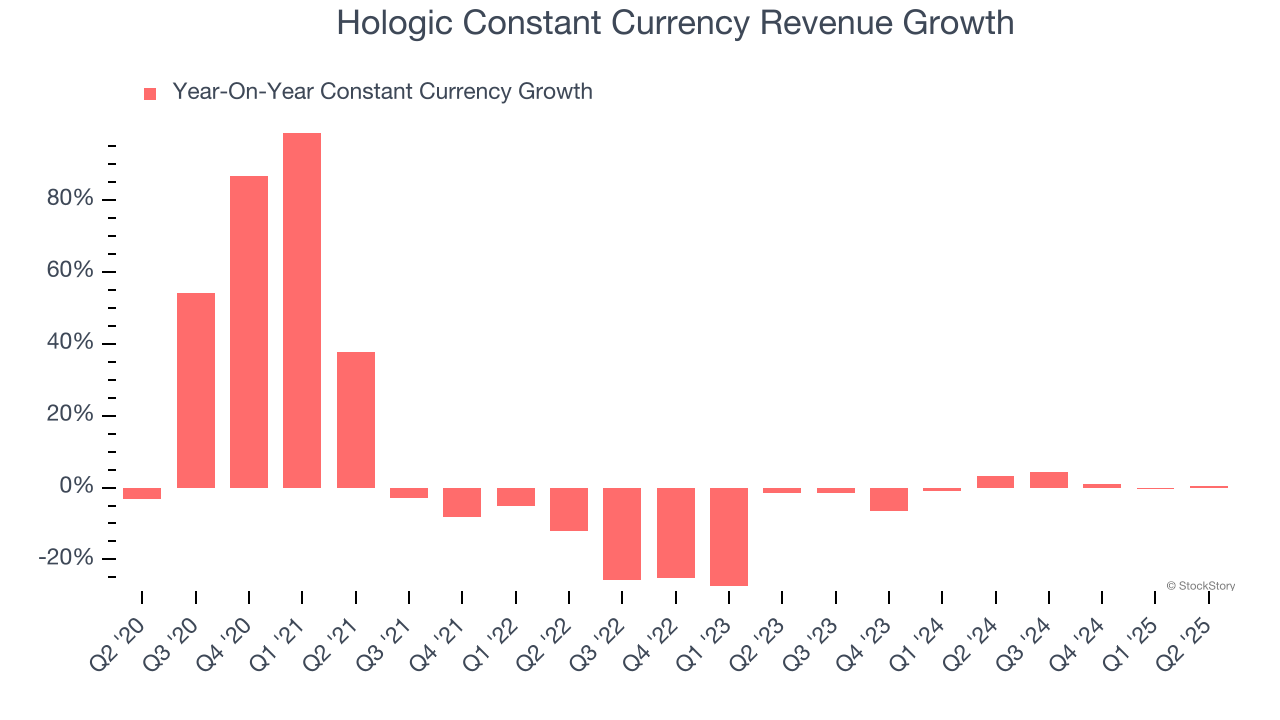
This quarter, Hologic reported modest year-on-year revenue growth of 1.2% but beat Wall Street’s estimates by 1.7%. Company management is currently guiding for a 4.8% year-on-year increase in sales next quarter.
Looking further ahead, sell-side analysts expect revenue to grow 4.2% over the next 12 months. While this projection implies its newer products and services will catalyze better top-line performance, it is still below average for the sector.
Unless you’ve been living under a rock, it should be obvious by now that generative AI is going to have a huge impact on how large corporations do business. While Nvidia and AMD are trading close to all-time highs, we prefer a lesser-known (but still profitable) stock benefiting from the rise of AI. Click here to access our free report one of our favorites growth stories.
Operating Margin
Operating margin is one of the best measures of profitability because it tells us how much money a company takes home after subtracting all core expenses, like marketing and R&D.
Hologic has been an efficient company over the last five years. It was one of the more profitable businesses in the healthcare sector, boasting an average operating margin of 29.5%.
Looking at the trend in its profitability, Hologic’s operating margin decreased by 29.7 percentage points over the last five years. This raises questions about the company’s expense base because its revenue growth should have given it leverage on its fixed costs, resulting in better economies of scale and profitability.
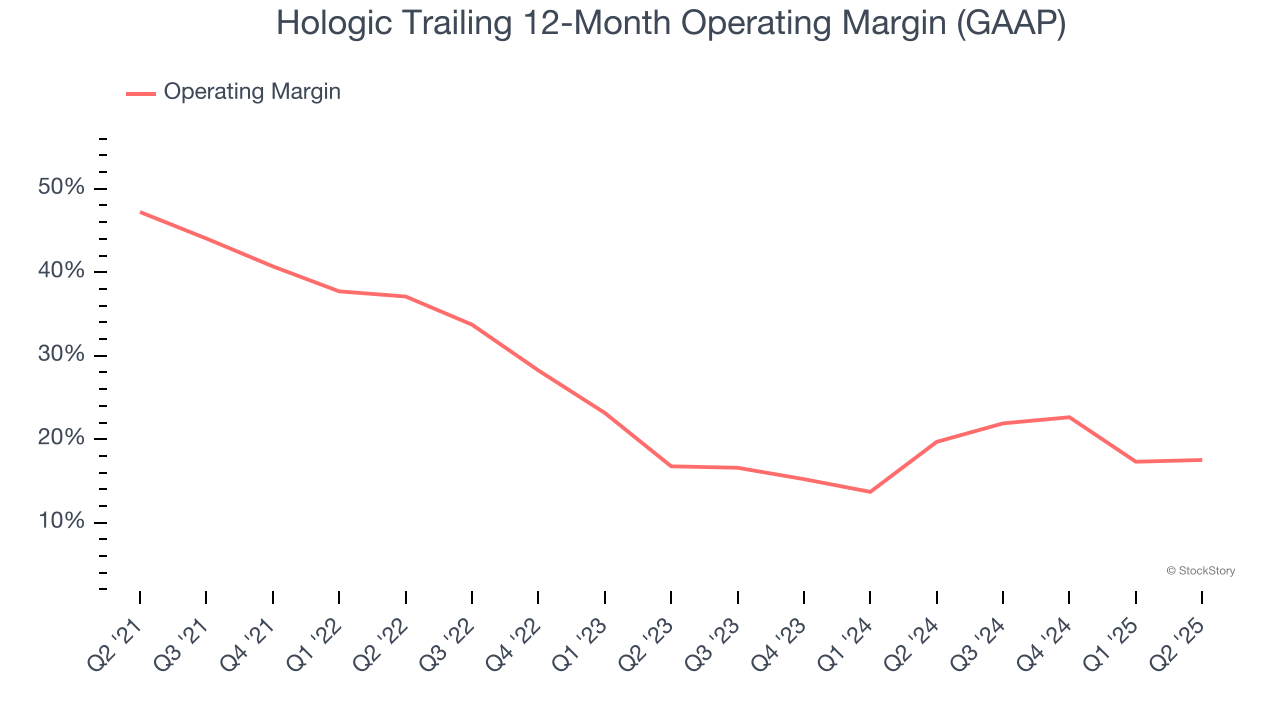
In Q2, Hologic generated an operating margin profit margin of 24.9%, in line with the same quarter last year. This indicates the company’s overall cost structure has been relatively stable.
Earnings Per Share
Revenue trends explain a company’s historical growth, but the long-term change in earnings per share (EPS) points to the profitability of that growth – for example, a company could inflate its sales through excessive spending on advertising and promotions.
Hologic’s EPS grew at a remarkable 10% compounded annual growth rate over the last five years, higher than its 4.2% annualized revenue growth. This tells us the company became more profitable on a per-share basis as it expanded.
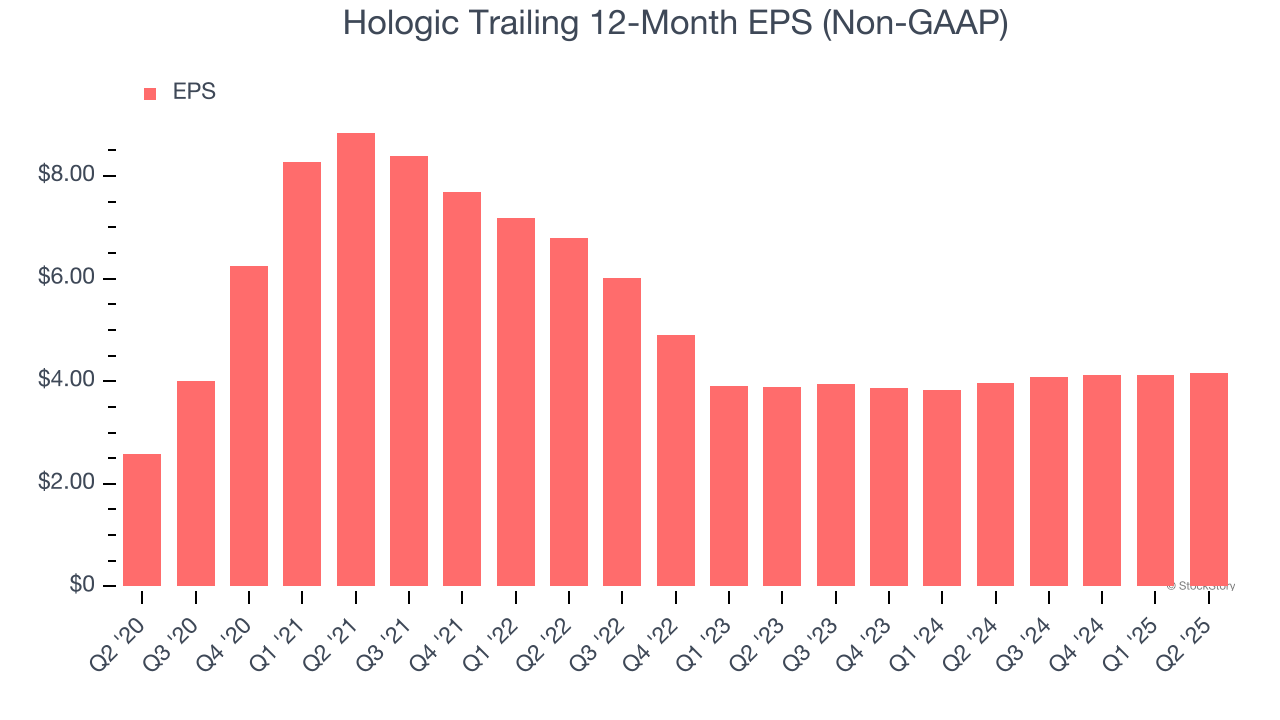
Diving into the nuances of Hologic’s earnings can give us a better understanding of its performance. A five-year view shows that Hologic has repurchased its stock, shrinking its share count by 13.6%. This tells us its EPS outperformed its revenue not because of increased operational efficiency but financial engineering, as buybacks boost per share earnings. 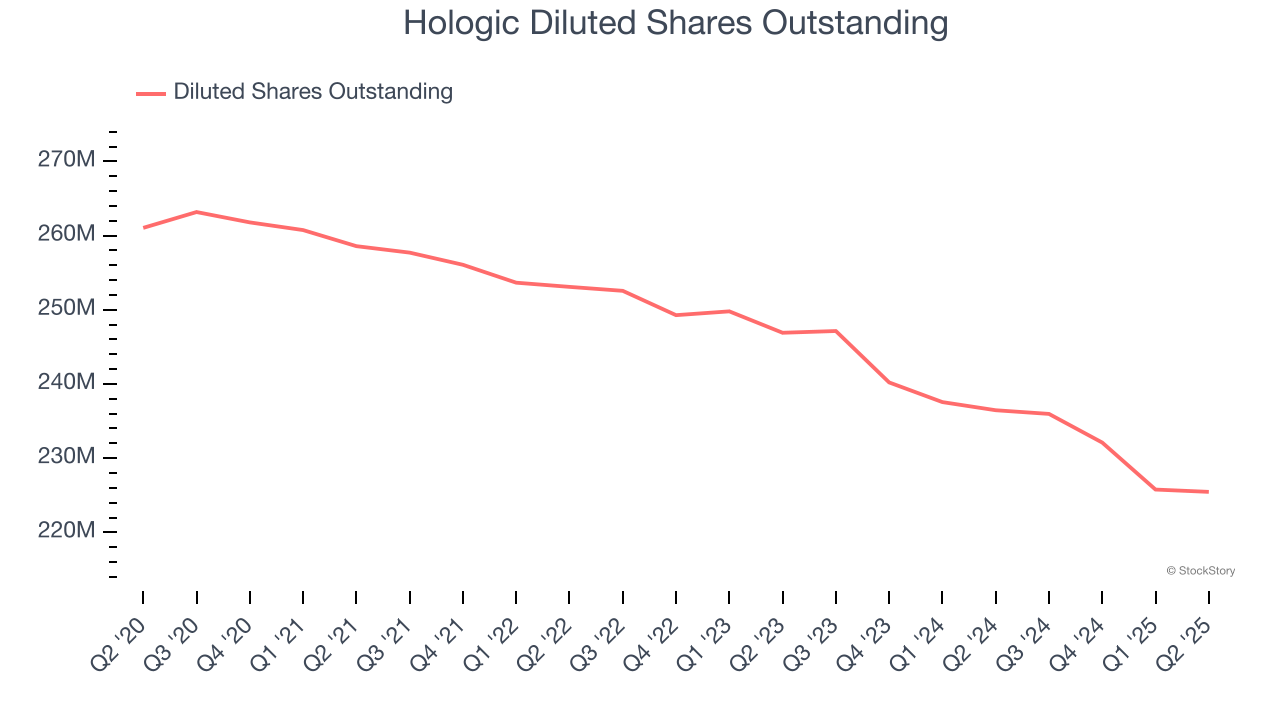
In Q2, Hologic reported adjusted EPS at $1.08, up from $1.06 in the same quarter last year. This print beat analysts’ estimates by 2.7%. Over the next 12 months, Wall Street expects Hologic’s full-year EPS of $4.15 to grow 5.3%.
Key Takeaways from Hologic’s Q2 Results
We enjoyed seeing Hologic beat analysts’ EPS guidance for next quarter expectations this quarter. We were also happy its revenue and EPS outperformed Wall Street’s estimates this quarter. Overall, this print had some key positives. The stock traded up 6.8% to $69.36 immediately following the results.
Hologic put up rock-solid earnings, but one quarter doesn’t necessarily make the stock a buy. Let’s see if this is a good investment. The latest quarter does matter, but not nearly as much as longer-term fundamentals and valuation, when deciding if the stock is a buy. We cover that in our actionable full research report which you can read here, it’s free.


