

Pool equipment and automation systems manufacturer Hayward Holdings (NYSE: HAYW) reported revenue ahead of Wall Street’s expectations in Q2 CY2025, with sales up 5.3% year on year to $299.6 million. The company expects the full year’s revenue to be around $1.09 billion, close to analysts’ estimates. Its non-GAAP profit of $0.24 per share was 6.1% above analysts’ consensus estimates.
Is now the time to buy Hayward? Find out by accessing our full research report, it’s free.
Hayward (HAYW) Q2 CY2025 Highlights:
- Revenue: $299.6 million vs analyst estimates of $289.8 million (5.3% year-on-year growth, 3.4% beat)
- Adjusted EPS: $0.24 vs analyst estimates of $0.23 (6.1% beat)
- Adjusted EBITDA: $88.24 million vs analyst estimates of $83.73 million (29.5% margin, 5.4% beat)
- The company slightly lifted its revenue guidance for the full year to $1.09 billion at the midpoint from $1.08 billion
- EBITDA guidance for the full year is $285 million at the midpoint, in line with analyst expectations
- Operating Margin: 23.8%, in line with the same quarter last year
- Free Cash Flow Margin: 62.1%, down from 99.3% in the same quarter last year
- Market Capitalization: $3.24 billion
Company Overview
Credited with introducing the first variable-speed pool pump, Hayward (NYSE: HAYW) makes residential and commercial pool equipment and accessories.
Revenue Growth
Examining a company’s long-term performance can provide clues about its quality. Any business can put up a good quarter or two, but the best consistently grow over the long haul. Regrettably, Hayward’s sales grew at a mediocre 6.7% compounded annual growth rate over the last five years. This fell short of our benchmark for the industrials sector and is a poor baseline for our analysis.
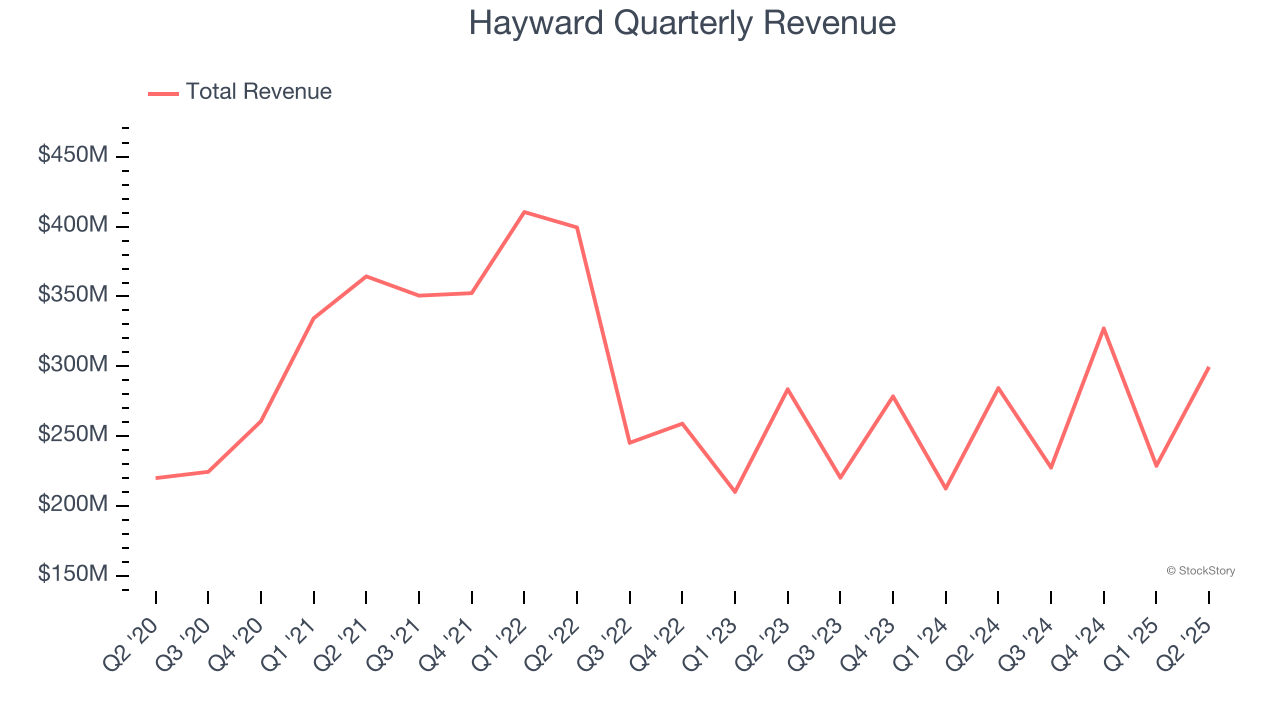
We at StockStory place the most emphasis on long-term growth, but within industrials, a half-decade historical view may miss cycles, industry trends, or a company capitalizing on catalysts such as a new contract win or a successful product line. Hayward’s recent performance shows its demand has slowed as its annualized revenue growth of 4.2% over the last two years was below its five-year trend. 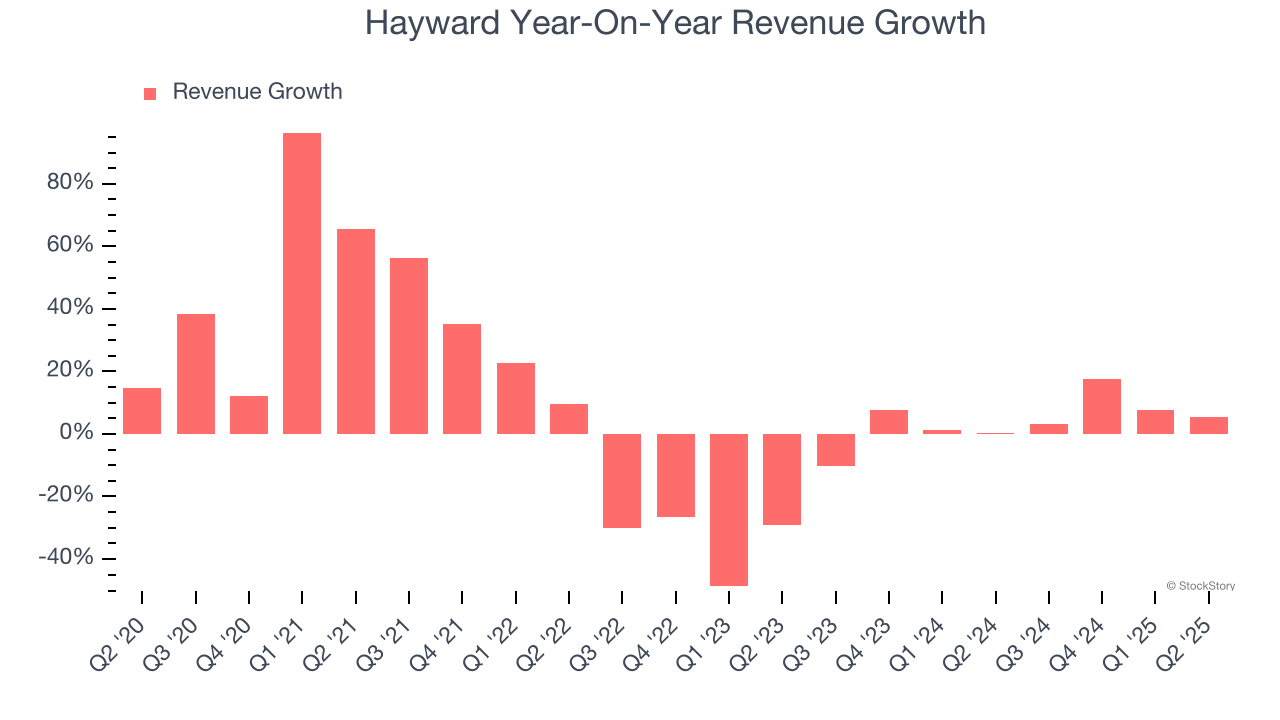
This quarter, Hayward reported year-on-year revenue growth of 5.3%, and its $299.6 million of revenue exceeded Wall Street’s estimates by 3.4%.
Looking ahead, sell-side analysts expect revenue to grow 2.6% over the next 12 months, a slight deceleration versus the last two years. This projection is underwhelming and suggests its products and services will see some demand headwinds.
Today’s young investors won’t have read the timeless lessons in Gorilla Game: Picking Winners In High Technology because it was written more than 20 years ago when Microsoft and Apple were first establishing their supremacy. But if we apply the same principles, then enterprise software stocks leveraging their own generative AI capabilities may well be the Gorillas of the future. So, in that spirit, we are excited to present our Special Free Report on a profitable, fast-growing enterprise software stock that is already riding the automation wave and looking to catch the generative AI next.
Operating Margin
Hayward’s operating margin has been trending up over the last 12 months and averaged 20.3% over the last five years. On top of that, its profitability was elite for an industrials business thanks to its efficient cost structure and economies of scale. This result isn’t surprising as its high gross margin gives it a favorable starting point.
Looking at the trend in its profitability, Hayward’s operating margin might fluctuated slightly but has generally stayed the same over the last five years. This raises questions about the company’s expense base because its revenue growth should have given it leverage on its fixed costs, resulting in better economies of scale and profitability.
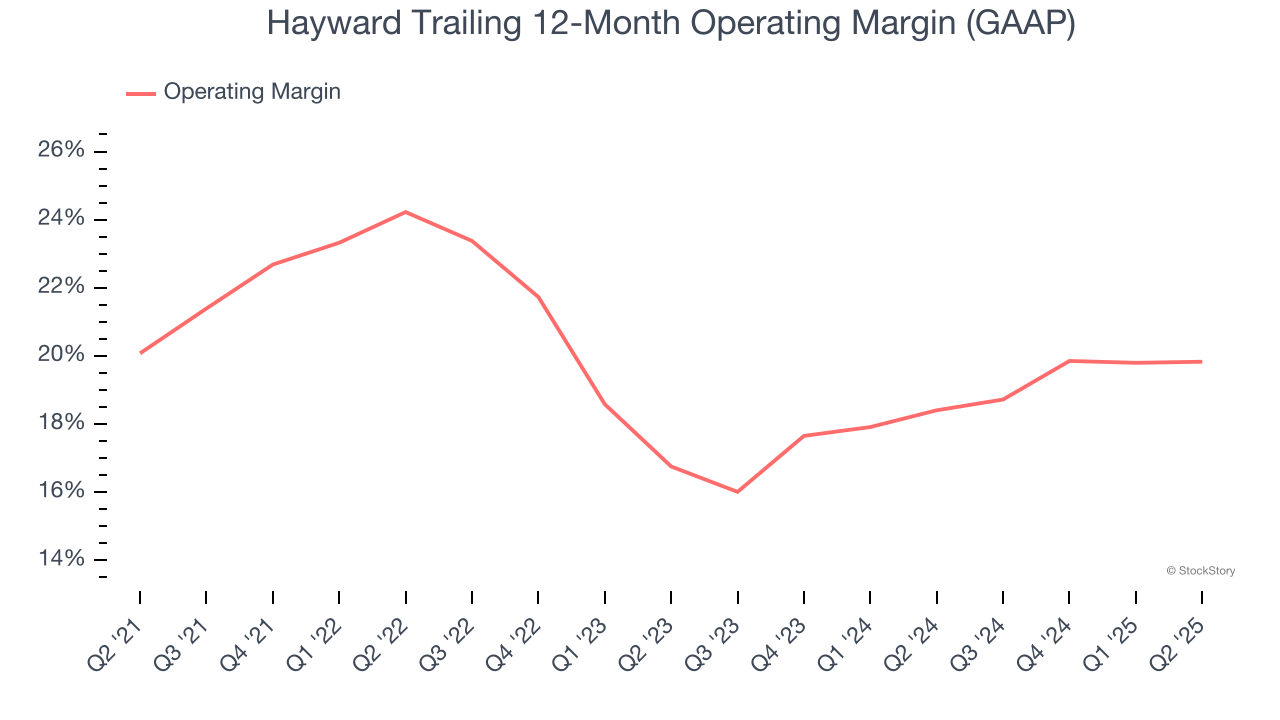
This quarter, Hayward generated an operating margin profit margin of 23.8%, in line with the same quarter last year. This indicates the company’s cost structure has recently been stable.
Earnings Per Share
We track the long-term change in earnings per share (EPS) for the same reason as long-term revenue growth. Compared to revenue, however, EPS highlights whether a company’s growth is profitable.
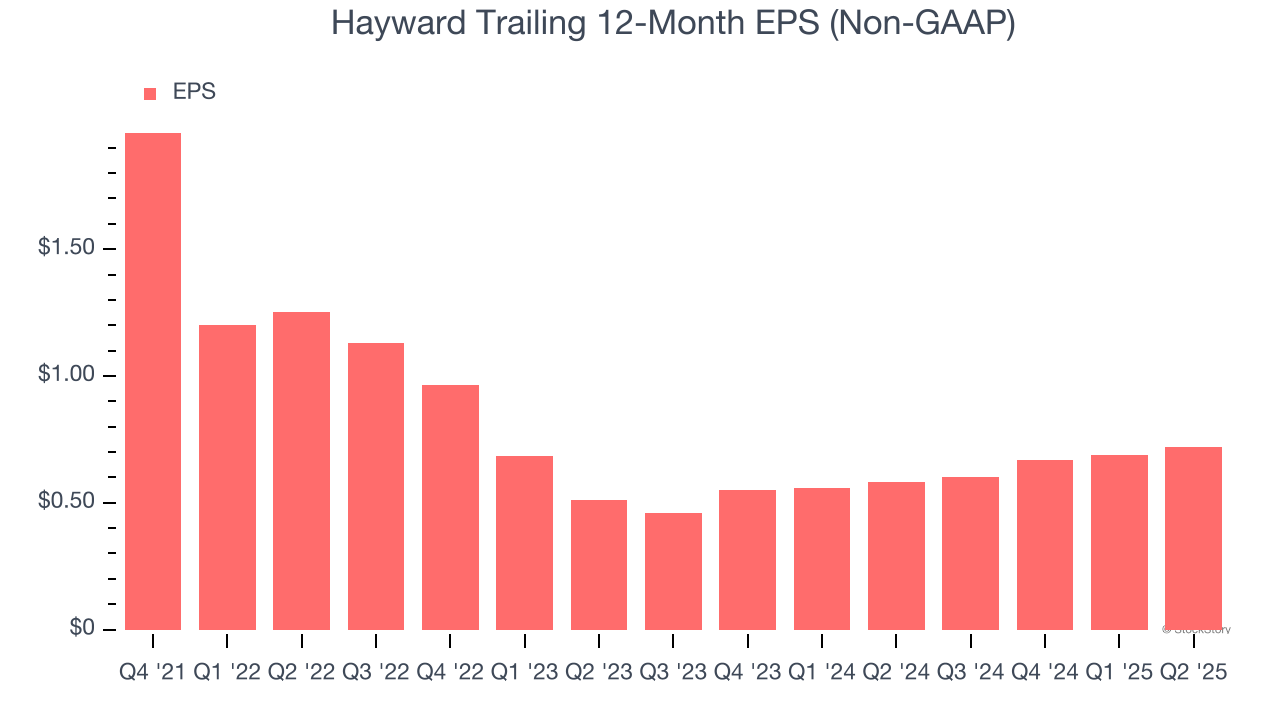
Hayward’s full-year EPS dropped 186%, or 30% annually, over the last four years. We tend to steer our readers away from companies with falling revenue and EPS, where diminishing earnings could imply changing secular trends and preferences. If the tide turns unexpectedly, Hayward’s low margin of safety could leave its stock price susceptible to large downswings.
Like with revenue, we analyze EPS over a shorter period to see if we are missing a change in the business.
Hayward’s EPS grew at an astounding 18.8% compounded annual growth rate over the last two years, higher than its 4.2% annualized revenue growth. This tells us the company became more profitable on a per-share basis as it expanded.
Diving into Hayward’s quality of earnings can give us a better understanding of its performance. While we mentioned earlier that Hayward’s operating margin was flat this quarter, a two-year view shows its margin has expanded by 1.6 percentage points. This was the most relevant factor (aside from the revenue impact) behind its higher earnings; interest expenses and taxes can also affect EPS but don’t tell us as much about a company’s fundamentals.
In Q2, Hayward reported EPS at $0.24, up from $0.21 in the same quarter last year. This print beat analysts’ estimates by 6.1%. Over the next 12 months, Wall Street expects Hayward’s full-year EPS of $0.72 to grow 8%.
Key Takeaways from Hayward’s Q2 Results
We enjoyed seeing Hayward beat analysts’ revenue, EPS, and EBITDA expectations this quarter. We were also glad it lifted its full-year revenue guidance. Overall, we think this was a solid quarter with some key metrics above expectations. The stock traded up 2.7% to $15.35 immediately after reporting.
Hayward had an encouraging quarter, but one earnings result doesn’t necessarily make the stock a buy. Let’s see if this is a good investment. If you’re making that decision, you should consider the bigger picture of valuation, business qualities, as well as the latest earnings. We cover that in our actionable full research report which you can read here, it’s free.


