
Medical device company DexCom (NASDAQ: DXCM) beat Wall Street’s revenue expectations in Q2 CY2025, with sales up 15.2% year on year to $1.16 billion. The company expects the full year’s revenue to be around $4.61 billion, close to analysts’ estimates. Its non-GAAP profit of $0.48 per share was 7.8% above analysts’ consensus estimates.
Is now the time to buy DexCom? Find out by accessing our full research report, it’s free.
DexCom (DXCM) Q2 CY2025 Highlights:
- Revenue: $1.16 billion vs analyst estimates of $1.13 billion (15.2% year-on-year growth, 2.8% beat)
- Adjusted EPS: $0.48 vs analyst estimates of $0.45 (7.8% beat)
- Adjusted EBITDA: $327.6 million vs analyst estimates of $314.6 million (28.3% margin, 4.1% beat)
- The company slightly lifted its revenue guidance for the full year to $4.61 billion at the midpoint from $4.6 billion
- Operating Margin: 18.4%, up from 15.7% in the same quarter last year
- Organic Revenue rose 15% year on year (16.2% in the same quarter last year)
- Market Capitalization: $35.03 billion
Company Overview
Founded in 1999 and receiving its first FDA approval in 2006, DexCom (NASDAQ: DXCM) develops and sells continuous glucose monitoring systems that allow people with diabetes to track their blood sugar levels without repeated finger pricks.
Revenue Growth
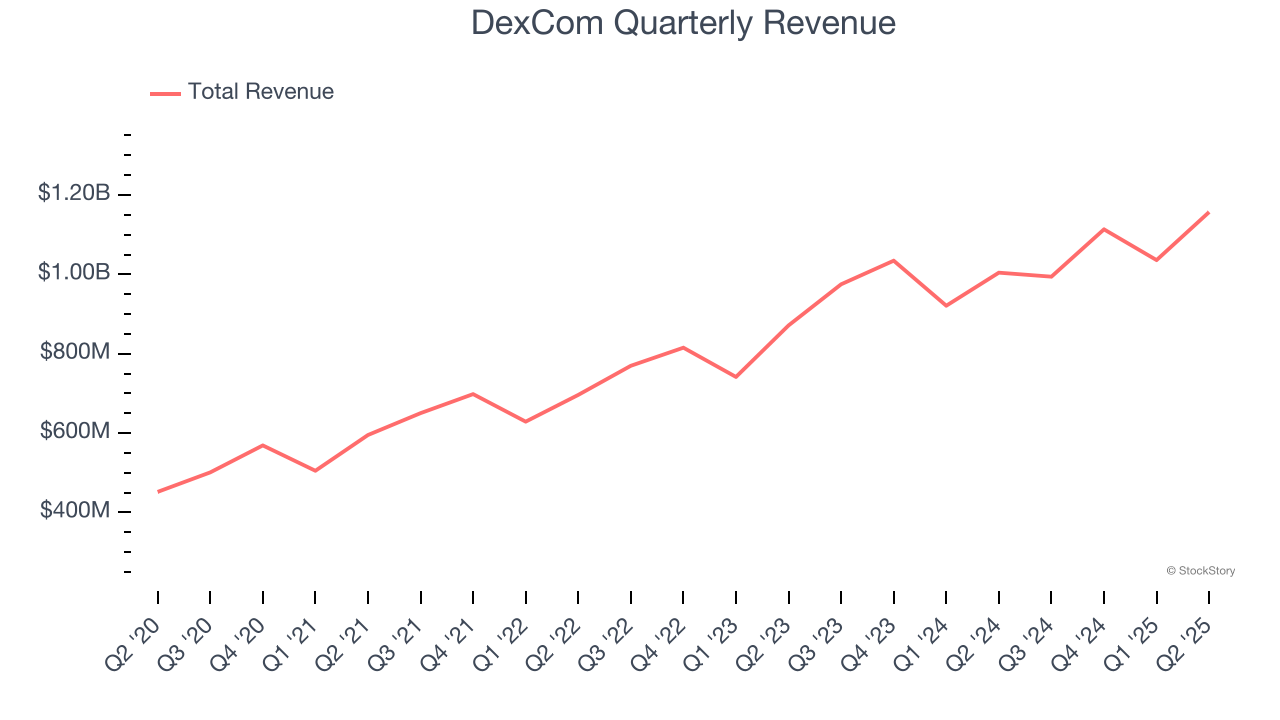
A company’s long-term sales performance is one signal of its overall quality. Any business can put up a good quarter or two, but many enduring ones grow for years. Over the last five years, DexCom grew its sales at an impressive 20.2% compounded annual growth rate. Its growth surpassed the average healthcare company and shows its offerings resonate with customers, a great starting point for our analysis.
Long-term growth is the most important, but within healthcare, a half-decade historical view may miss new innovations or demand cycles. DexCom’s annualized revenue growth of 16% over the last two years is below its five-year trend, but we still think the results suggest healthy demand. 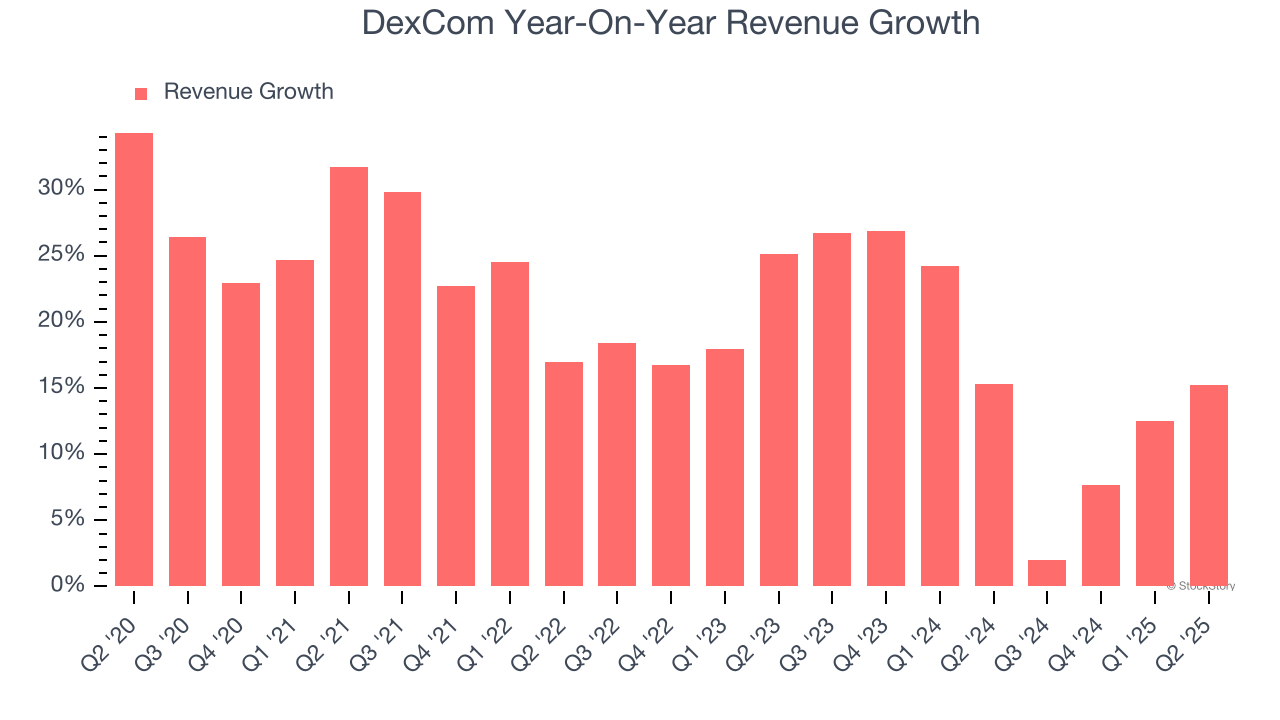
We can better understand the company’s sales dynamics by analyzing its organic revenue, which strips out one-time events like acquisitions and currency fluctuations that don’t accurately reflect its fundamentals. Over the last two years, DexCom’s organic revenue averaged 17.9% year-on-year growth. Because this number is better than its two-year revenue growth, we can see that some mixture of divestitures and foreign exchange rates dampened its headline results. 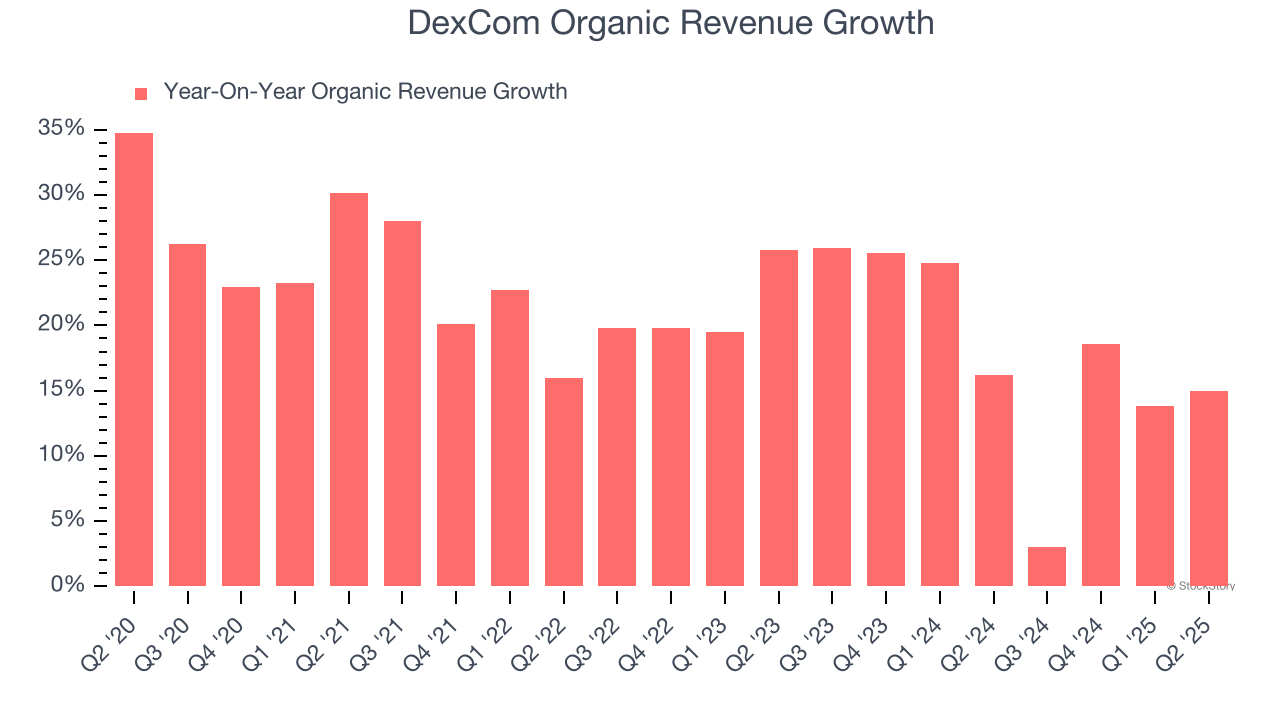
This quarter, DexCom reported year-on-year revenue growth of 15.2%, and its $1.16 billion of revenue exceeded Wall Street’s estimates by 2.8%.
Looking ahead, sell-side analysts expect revenue to grow 15.5% over the next 12 months, similar to its two-year rate. This projection is noteworthy and implies the market is forecasting success for its products and services.
Today’s young investors won’t have read the timeless lessons in Gorilla Game: Picking Winners In High Technology because it was written more than 20 years ago when Microsoft and Apple were first establishing their supremacy. But if we apply the same principles, then enterprise software stocks leveraging their own generative AI capabilities may well be the Gorillas of the future. So, in that spirit, we are excited to present our Special Free Report on a profitable, fast-growing enterprise software stock that is already riding the automation wave and looking to catch the generative AI next.
Operating Margin
Operating margin is one of the best measures of profitability because it tells us how much money a company takes home after subtracting all core expenses, like marketing and R&D.
DexCom’s operating margin might fluctuated slightly over the last 12 months but has generally stayed the same, averaging 14.7% over the last five years. This profitability was higher than the broader healthcare sector, showing it did a decent job managing its expenses.
Looking at the trend in its profitability, DexCom’s operating margin of 16% for the trailing 12 months may be around the same as five years ago, but it has increased by 2 percentage points over the last two years. This dynamic unfolded because its sales growth gave it operating leverage and shows it has some momentum on its side.
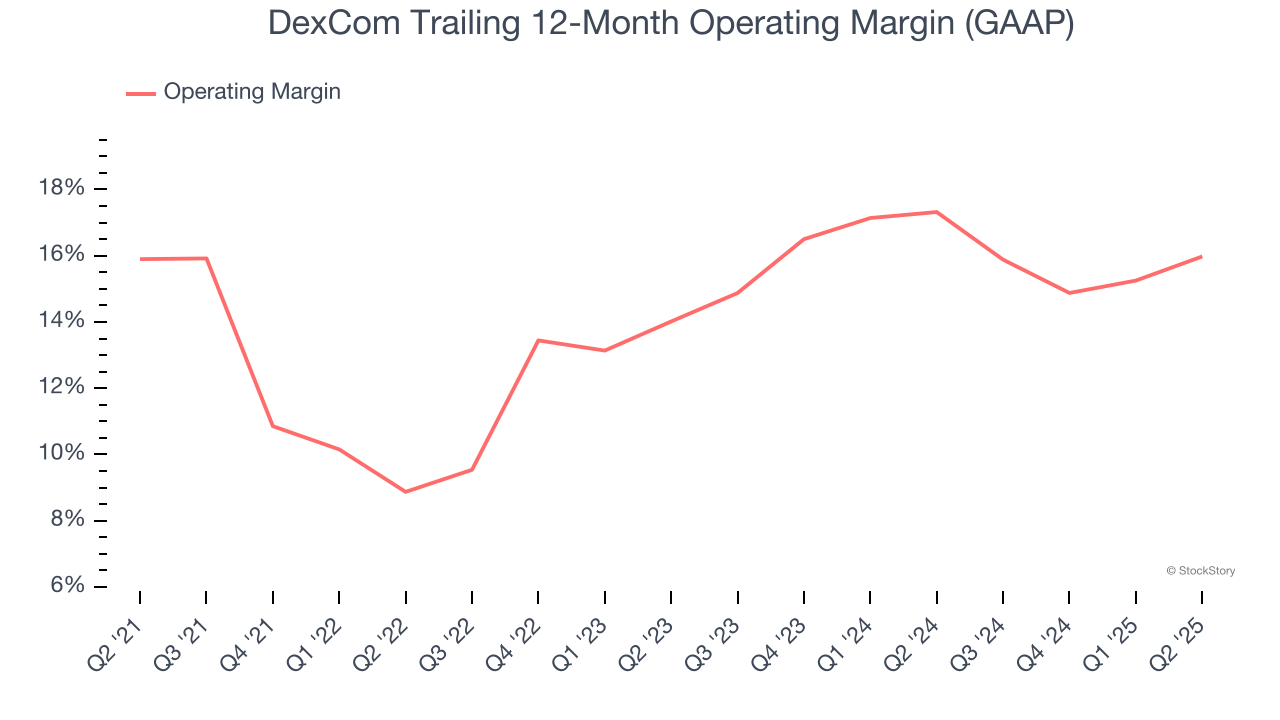
In Q2, DexCom generated an operating margin profit margin of 18.4%, up 2.6 percentage points year on year. This increase was a welcome development and shows it was more efficient.
Earnings Per Share
Revenue trends explain a company’s historical growth, but the long-term change in earnings per share (EPS) points to the profitability of that growth – for example, a company could inflate its sales through excessive spending on advertising and promotions.
DexCom’s EPS grew at an astounding 17.5% compounded annual growth rate over the last five years. Despite its operating margin improvement during that time, this performance was lower than its 20.2% annualized revenue growth, telling us that non-fundamental factors such as interest and taxes affected its ultimate earnings.
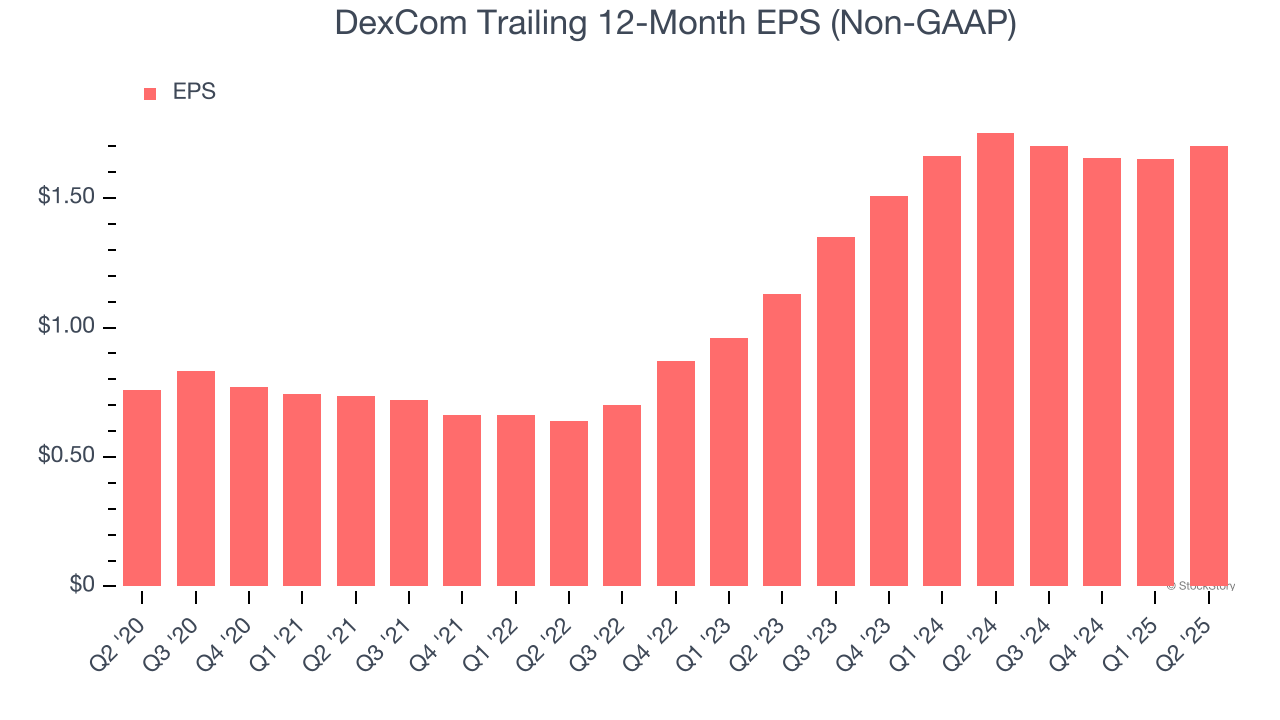
Diving into DexCom’s quality of earnings can give us a better understanding of its performance. A five-year view shows DexCom has diluted its shareholders, growing its share count by 5.2%. This has led to lower per share earnings. Taxes and interest expenses can also affect EPS but don’t tell us as much about a company’s fundamentals. 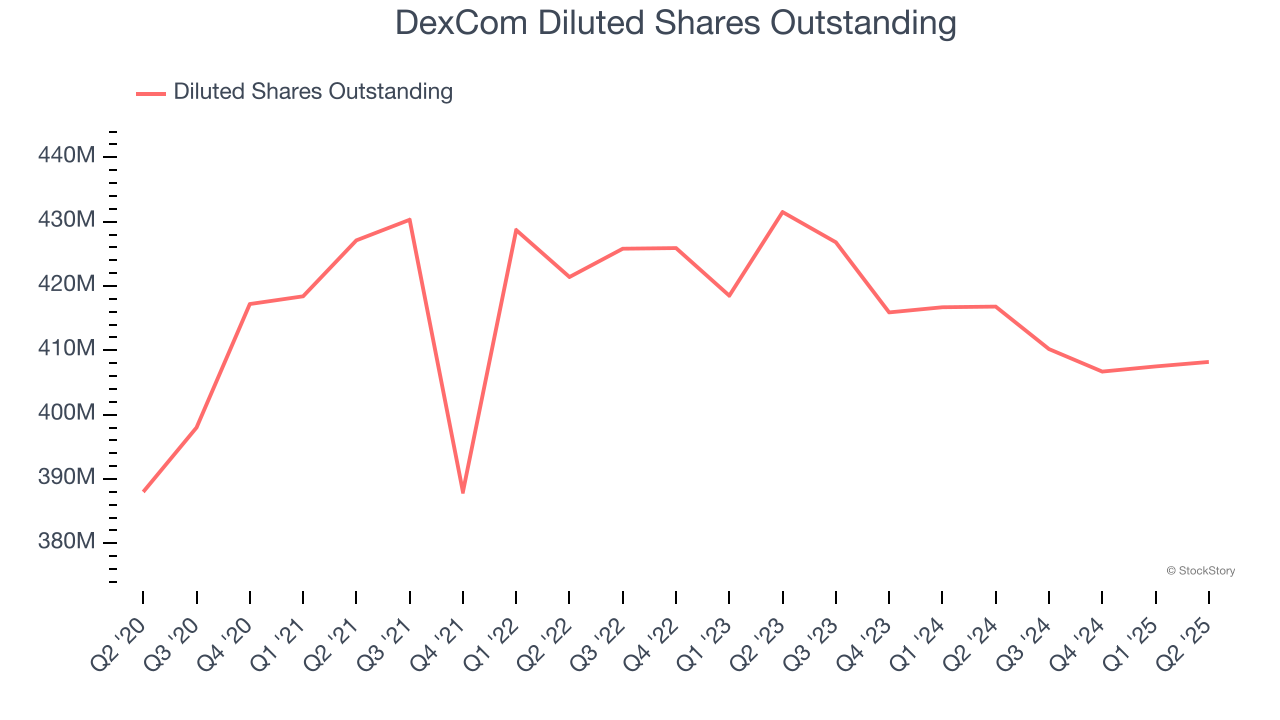
In Q2, DexCom reported adjusted EPS at $0.48, up from $0.43 in the same quarter last year. This print beat analysts’ estimates by 8.3%. Over the next 12 months, Wall Street expects DexCom’s full-year EPS of $1.70 to grow 36.9%.
Key Takeaways from DexCom’s Q2 Results
We enjoyed seeing DexCom beat analysts’ organic revenue, EPS, and EBITDA expectations this quarter. Overall, we think this was a solid quarter with some key areas of upside. The market seemed to be hoping for more, and the stock traded down 2.9% to $86.50 immediately following the results.
Should you buy the stock or not? The latest quarter does matter, but not nearly as much as longer-term fundamentals and valuation, when deciding if the stock is a buy. We cover that in our actionable full research report which you can read here, it’s free.