
Medical tech company CONMED (NYSE: CNMD) reported Q2 CY2025 results exceeding the market’s revenue expectations, with sales up 3.1% year on year to $342.3 million. The company expects the full year’s revenue to be around $1.37 billion, close to analysts’ estimates. Its non-GAAP profit of $1.15 per share was 2.4% above analysts’ consensus estimates.
Is now the time to buy CONMED? Find out by accessing our full research report, it’s free.
CONMED (CNMD) Q2 CY2025 Highlights:
- Revenue: $342.3 million vs analyst estimates of $338.3 million (3.1% year-on-year growth, 1.2% beat)
- Adjusted EPS: $1.15 vs analyst estimates of $1.12 (2.4% beat)
- Adjusted EBITDA: $68.6 million vs analyst estimates of $70.33 million (20% margin, 2.5% miss)
- The company slightly lifted its revenue guidance for the full year to $1.37 billion at the midpoint from $1.36 billion
- Management lowered its full-year Adjusted EPS guidance to $4.48 at the midpoint, a 1.1% decrease
- Operating Margin: 11.1%, down from 14.2% in the same quarter last year
- Constant Currency Revenue rose 2.9% year on year (5.2% in the same quarter last year)
- Market Capitalization: $1.56 billion
Company Overview
With over five decades of experience in surgical innovation since its founding in 1970, CONMED (NYSE: CNMD) develops and manufactures medical devices and equipment for surgical procedures, specializing in orthopedic and general surgery products.
Revenue Growth
A company’s long-term sales performance can indicate its overall quality. Any business can experience short-term success, but top-performing ones enjoy sustained growth for years. Over the last five years, CONMED grew its sales at a decent 8.8% compounded annual growth rate. Its growth was slightly above the average healthcare company and shows its offerings resonate with customers.
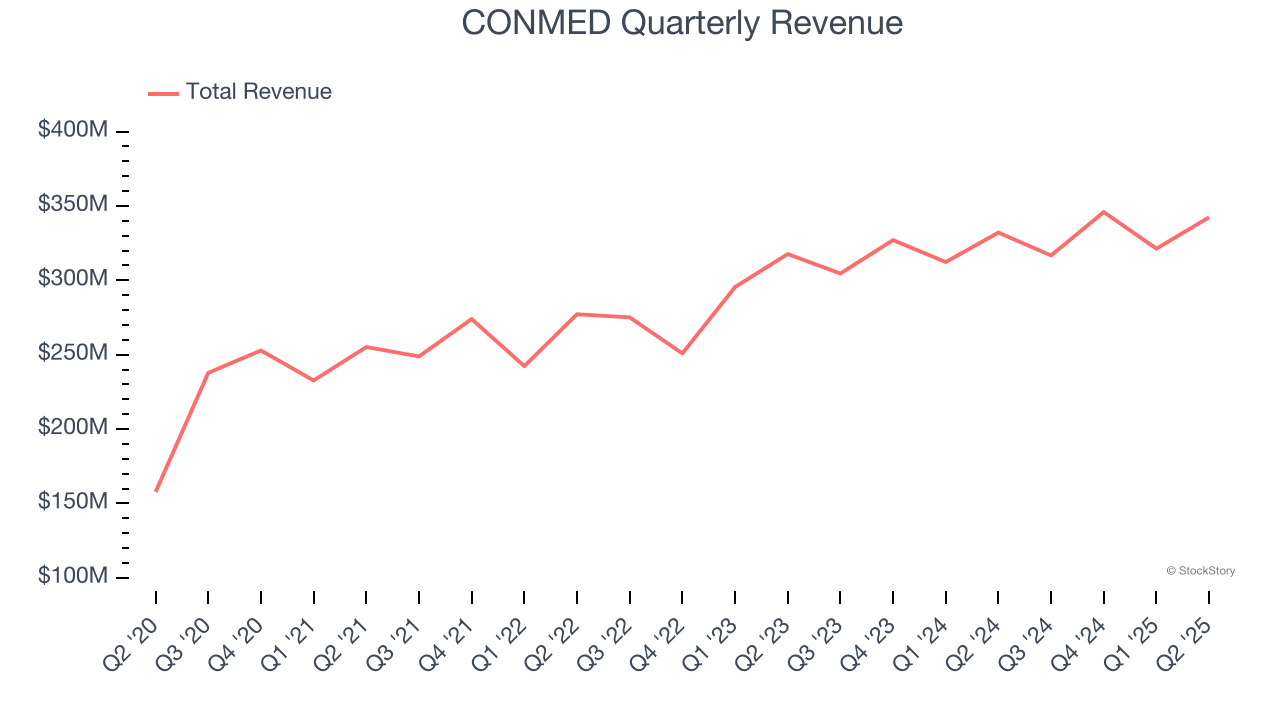
We at StockStory place the most emphasis on long-term growth, but within healthcare, a half-decade historical view may miss recent innovations or disruptive industry trends. CONMED’s annualized revenue growth of 7.9% over the last two years aligns with its five-year trend, suggesting its demand was stable. 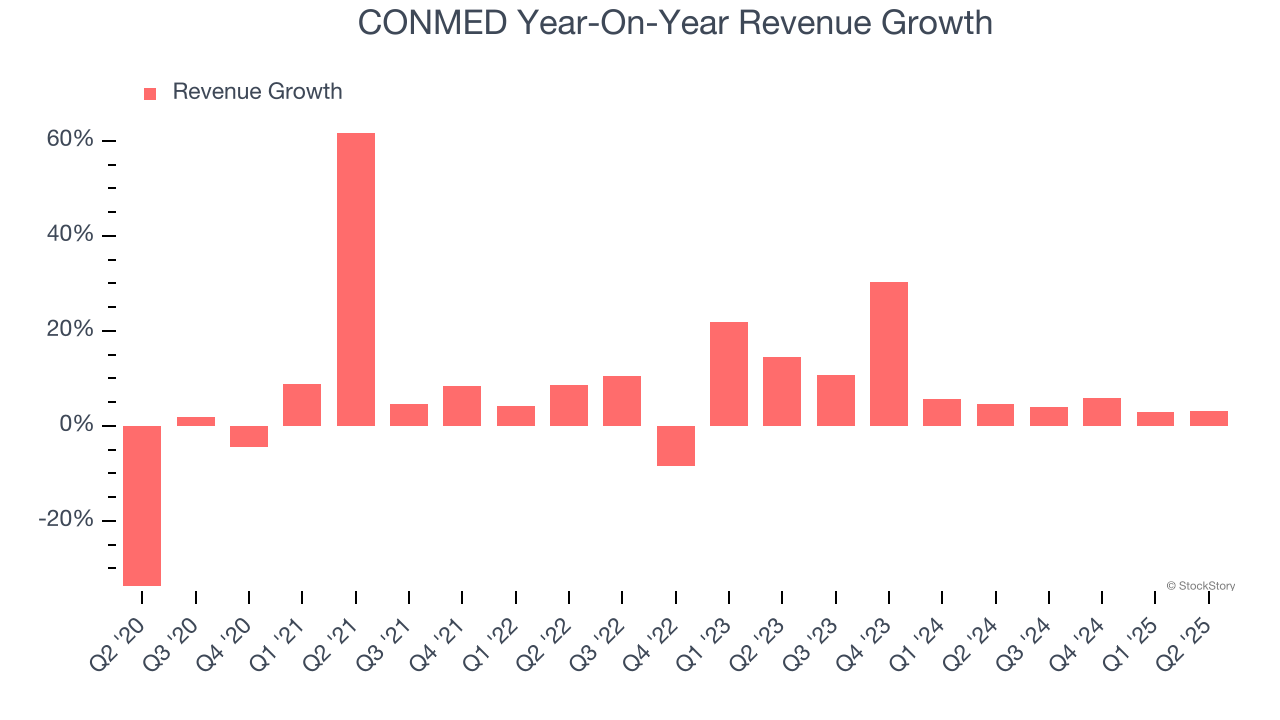
CONMED also reports sales performance excluding currency movements, which are outside the company’s control and not indicative of demand. Over the last two years, its constant currency sales averaged 8.9% year-on-year growth. Because this number aligns with its normal revenue growth, we can see that CONMED has properly hedged its foreign currency exposure. 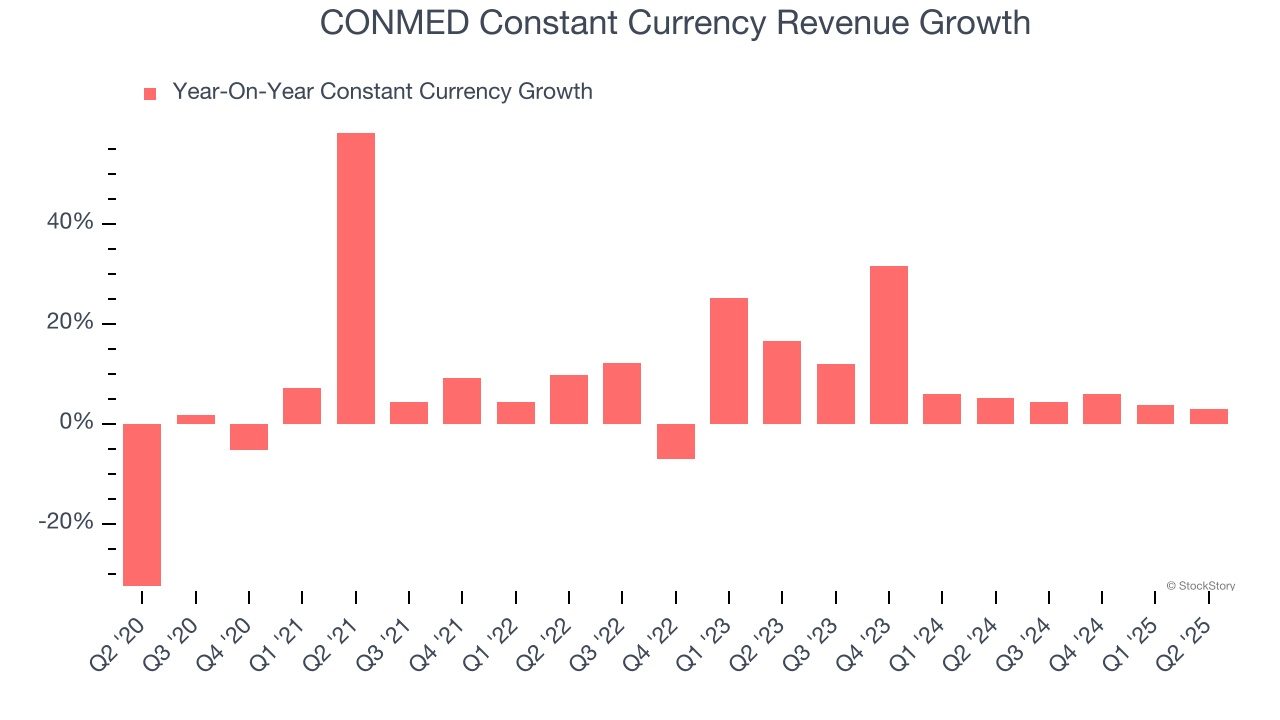
This quarter, CONMED reported modest year-on-year revenue growth of 3.1% but beat Wall Street’s estimates by 1.2%.
Looking ahead, sell-side analysts expect revenue to grow 5.5% over the next 12 months, a slight deceleration versus the last two years. Still, this projection is above the sector average and indicates the market sees some success for its newer products and services.
Here at StockStory, we certainly understand the potential of thematic investing. Diverse winners from Microsoft (MSFT) to Alphabet (GOOG), Coca-Cola (KO) to Monster Beverage (MNST) could all have been identified as promising growth stories with a megatrend driving the growth. So, in that spirit, we’ve identified a relatively under-the-radar profitable growth stock benefiting from the rise of AI, available to you FREE via this link.
Operating Margin
CONMED has done a decent job managing its cost base over the last five years. The company has produced an average operating margin of 10.6%, higher than the broader healthcare sector.
Analyzing the trend in its profitability, CONMED’s operating margin rose by 2.8 percentage points over the last five years, as its sales growth gave it operating leverage. This performance was mostly driven by its recent improvements as the company’s margin has increased by 7.4 percentage points on a two-year basis.
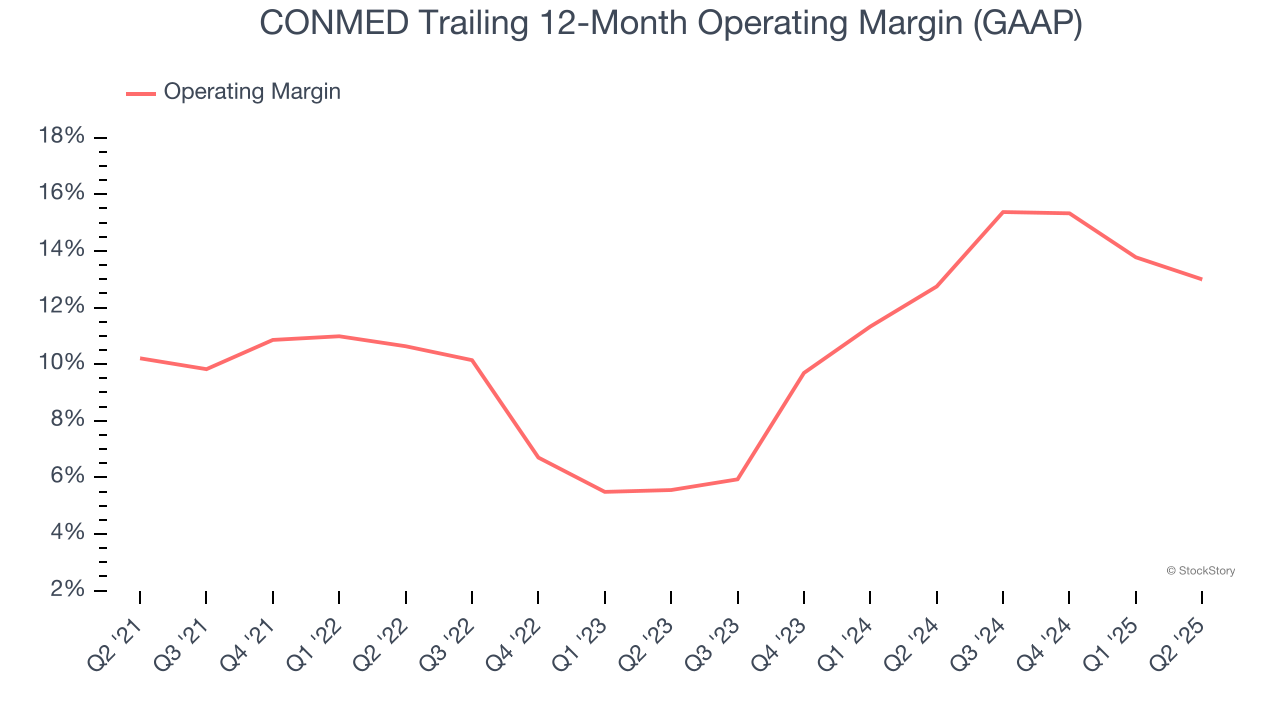
This quarter, CONMED generated an operating margin profit margin of 11.1%, down 3 percentage points year on year. This contraction shows it was less efficient because its expenses grew faster than its revenue.
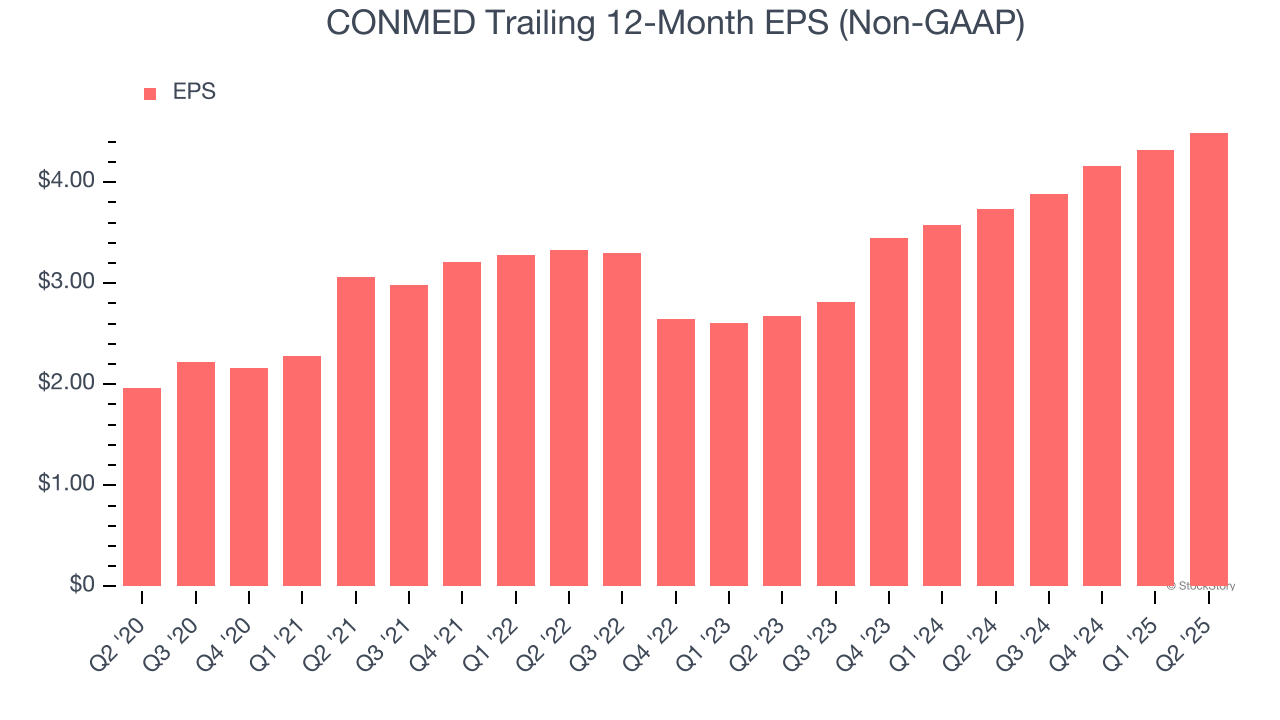
Earnings Per Share
We track the long-term change in earnings per share (EPS) for the same reason as long-term revenue growth. Compared to revenue, however, EPS highlights whether a company’s growth is profitable.
CONMED’s EPS grew at an astounding 18% compounded annual growth rate over the last five years, higher than its 8.8% annualized revenue growth. This tells us the company became more profitable on a per-share basis as it expanded.
We can take a deeper look into CONMED’s earnings quality to better understand the drivers of its performance. As we mentioned earlier, CONMED’s operating margin declined this quarter but expanded by 2.8 percentage points over the last five years. This was the most relevant factor (aside from the revenue impact) behind its higher earnings; interest expenses and taxes can also affect EPS but don’t tell us as much about a company’s fundamentals.
In Q2, CONMED reported adjusted EPS at $1.15, up from $0.98 in the same quarter last year. This print beat analysts’ estimates by 2.4%. Over the next 12 months, Wall Street expects CONMED’s full-year EPS of $4.49 to stay about the same.
Key Takeaways from CONMED’s Q2 Results
It was encouraging to see CONMED beat analysts’ full-year EPS guidance expectations this quarter. We were also happy its revenue narrowly outperformed Wall Street’s estimates. Overall, this print had some key positives. The stock remained flat at $50.14 immediately after reporting.
Is CONMED an attractive investment opportunity right now? If you’re making that decision, you should consider the bigger picture of valuation, business qualities, as well as the latest earnings. We cover that in our actionable full research report which you can read here, it’s free.


