
Digital infrastructure provider Applied Digital (NASDAQ: APLD) met Wall Street’s revenue expectations in Q2 CY2025, but sales fell by 13% year on year to $38.01 million. Its non-GAAP loss of $0.03 per share was 81.5% above analysts’ consensus estimates.
Is now the time to buy Applied Digital? Find out by accessing our full research report, it’s free.
Applied Digital (APLD) Q2 CY2025 Highlights:
- Revenue: $38.01 million vs analyst estimates of $37.94 million (13% year-on-year decline, in line)
- Adjusted EPS: -$0.03 vs analyst estimates of -$0.16 (beat)
- Adjusted EBITDA: $980,000 vs analyst estimates of $1.96 million (2.6% margin, relatively in line)
- Operating Margin: -54.5%, up from -85.5% in the same quarter last year
- Free Cash Flow was -$191.4 million compared to -$88.92 million in the same quarter last year
- Market Capitalization: $2.46 billion
“These long-term leases mark a defining moment for Polaris Forge 1, one of North America’s most ambitious data center projects,” said Wes Cummins, Chairman and CEO of Applied Digital.
Company Overview
Pivoting from its origins in cryptocurrency mining to become a key player in the AI infrastructure boom, Applied Digital (NASDAQ: APLD) designs and operates specialized data centers that provide high-performance computing infrastructure for artificial intelligence and blockchain applications.
Revenue Growth
A company’s long-term performance is an indicator of its overall quality. Even a bad business can shine for one or two quarters, but a top-tier one grows for years.
With $215.5 million in revenue over the past 12 months, Applied Digital is a small player in the business services space, which sometimes brings disadvantages compared to larger competitors benefiting from economies of scale and numerous distribution channels. On the bright side, it can grow faster because it has more room to expand.
As you can see below, Applied Digital’s sales grew at an incredible 294% compounded annual growth rate over the last three years. This shows it had high demand, a useful starting point for our analysis.
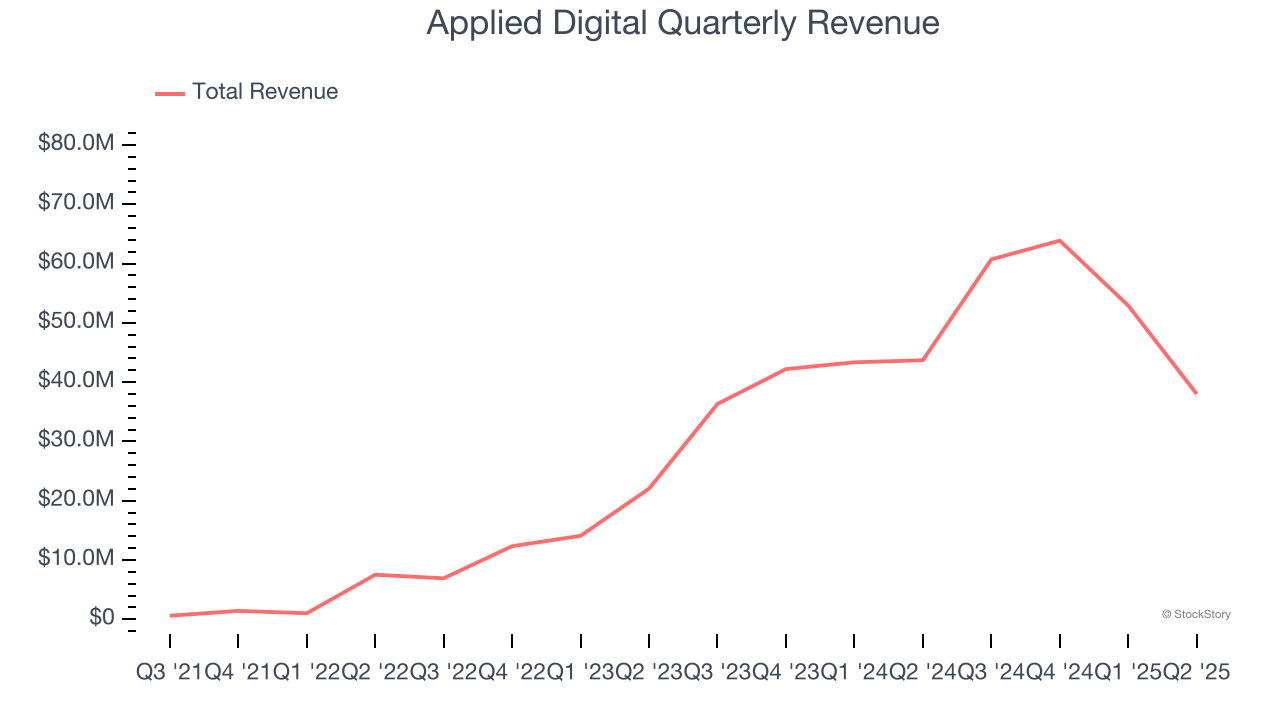
Long-term growth is the most important, but within business services, a stretched historical view may miss new innovations or demand cycles. Applied Digital’s annualized revenue growth of 97.2% over the last two years is below its three-year trend, but we still think the results suggest healthy demand. 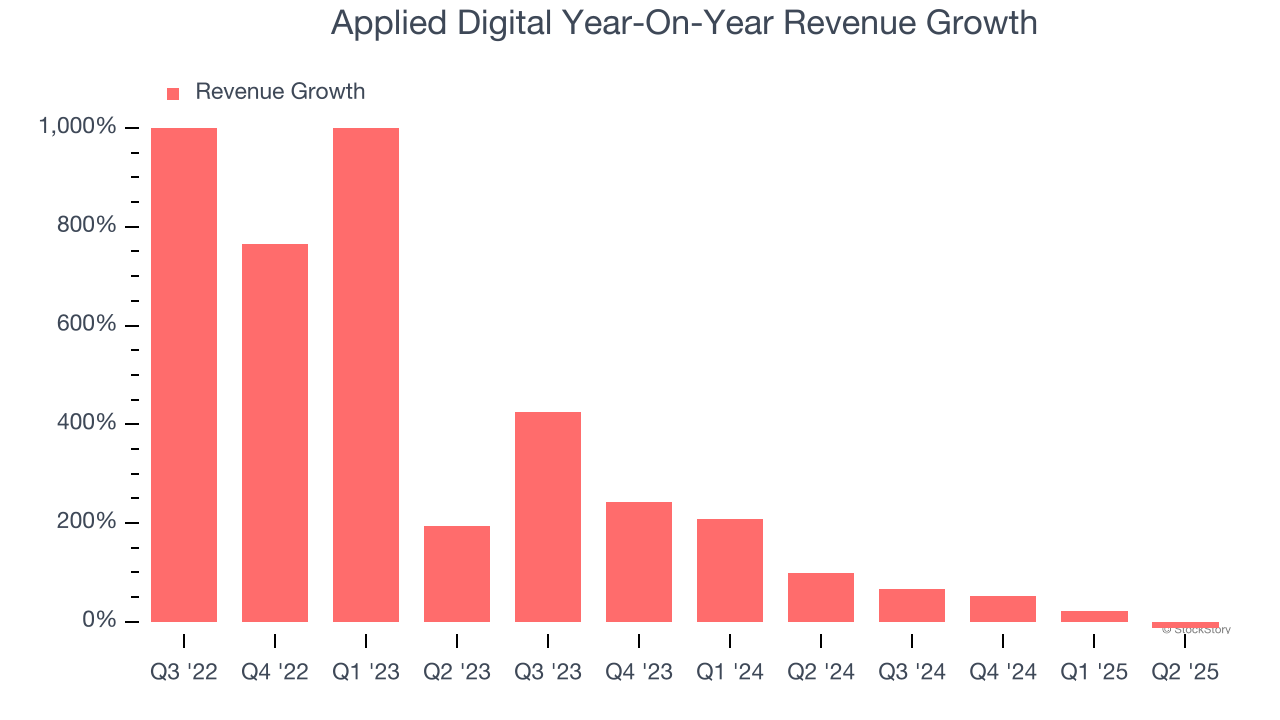
This quarter, Applied Digital reported a rather uninspiring 13% year-on-year revenue decline to $38.01 million of revenue, in line with Wall Street’s estimates.
Looking ahead, sell-side analysts expect revenue to grow 24.4% over the next 12 months, a deceleration versus the last two years. Despite the slowdown, this projection is healthy and suggests the market is forecasting success for its products and services.
Here at StockStory, we certainly understand the potential of thematic investing. Diverse winners from Microsoft (MSFT) to Alphabet (GOOG), Coca-Cola (KO) to Monster Beverage (MNST) could all have been identified as promising growth stories with a megatrend driving the growth. So, in that spirit, we’ve identified a relatively under-the-radar profitable growth stock benefiting from the rise of AI, available to you FREE via this link.
Operating Margin
Applied Digital’s high expenses have contributed to an average operating margin of negative 48.6% over the last four years. Unprofitable business services companies require extra attention because they could get caught swimming naked when the tide goes out. It’s hard to trust that the business can endure a full cycle.
On the plus side, Applied Digital’s operating margin rose over the last four years, as its sales growth gave it operating leverage. Still, it will take much more for the company to reach long-term profitability.
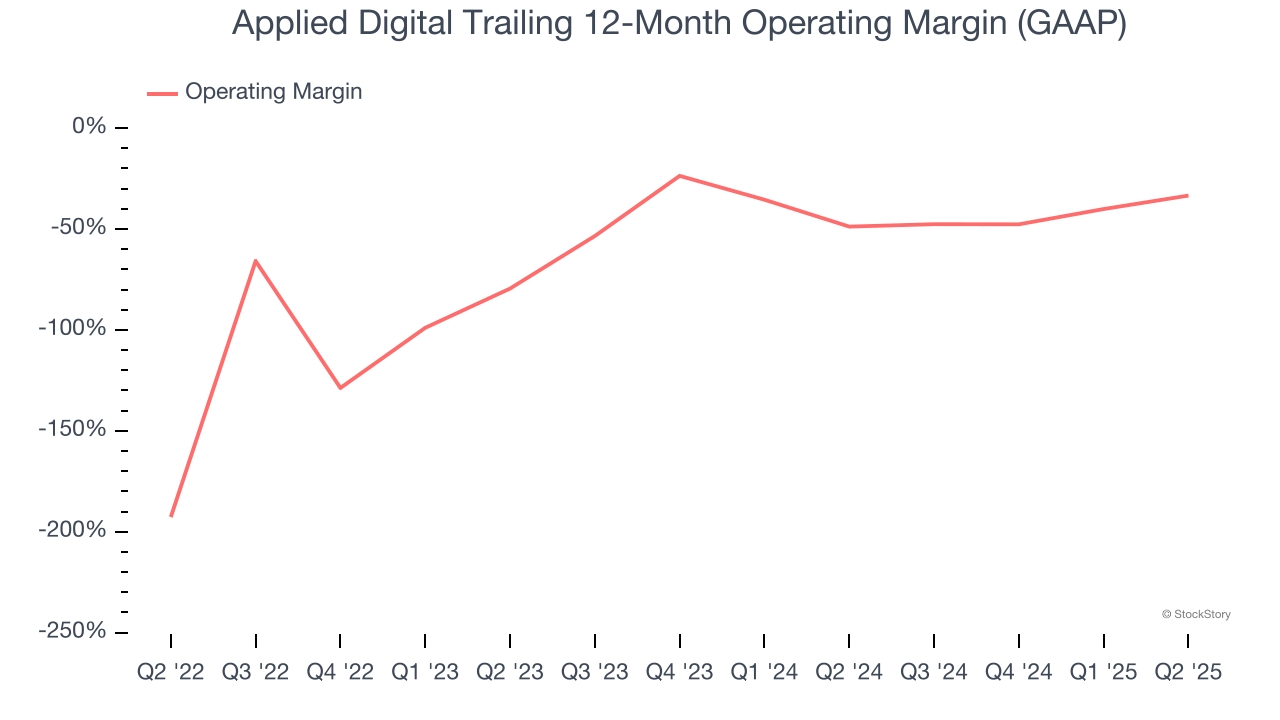
Applied Digital’s operating margin was negative 54.5% this quarter.
Cash Is King
Free cash flow isn't a prominently featured metric in company financials and earnings releases, but we think it's telling because it accounts for all operating and capital expenses, making it tough to manipulate. Cash is king.
Applied Digital’s demanding reinvestments have drained its resources over the last four years, putting it in a pinch and limiting its ability to return capital to investors. Its free cash flow margin averaged negative 236%, meaning it lit $235.63 of cash on fire for every $100 in revenue.
Taking a step back, an encouraging sign is that Applied Digital’s margin expanded during that time. In light of its glaring cash burn, however, this improvement is a bucket of hot water in a cold ocean.
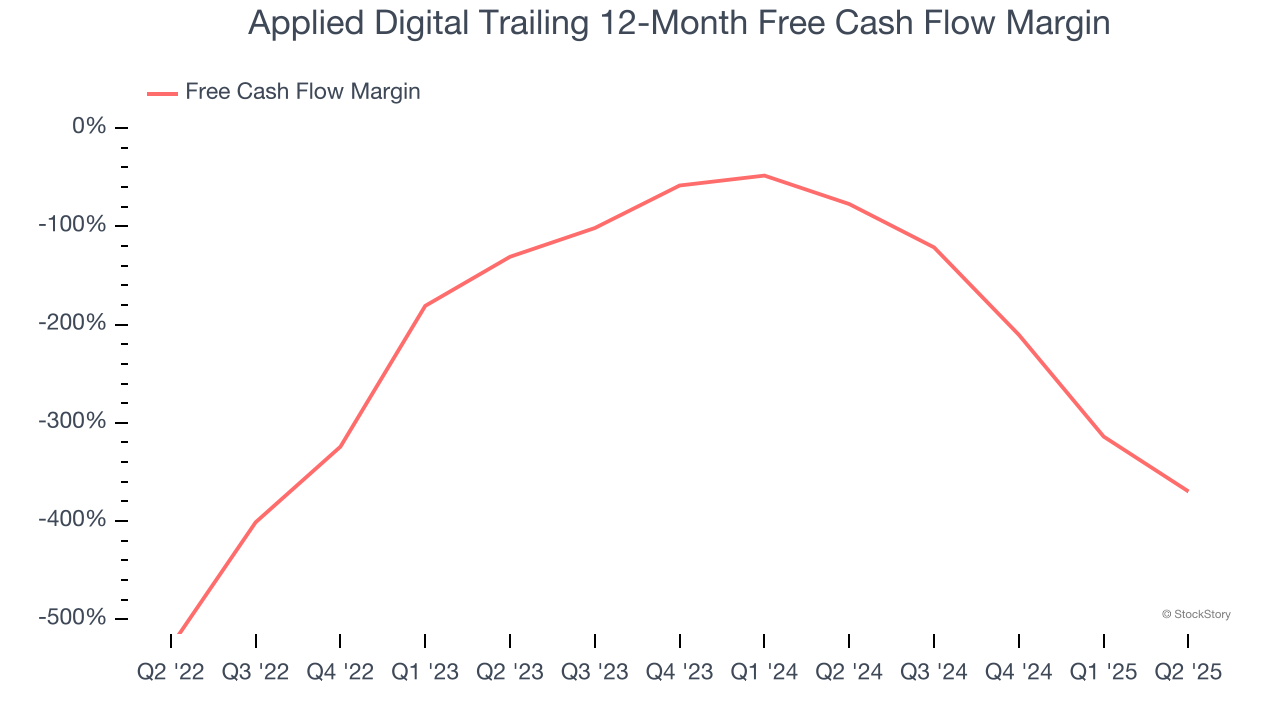
Applied Digital burned through $191.4 million of cash in Q2, equivalent to a negative 504% margin. The company’s cash burn increased from $88.92 million of lost cash in the same quarter last year.
Key Takeaways from Applied Digital’s Q2 Results
We were impressed by how significantly Applied Digital blew past analysts’ EPS expectations this quarter despite in line revenue. Zooming out, we think this was a solid print. The stock traded up 5% to $10.52 immediately following the results.
Indeed, Applied Digital had a rock-solid quarterly earnings result, but is this stock a good investment here? If you’re making that decision, you should consider the bigger picture of valuation, business qualities, as well as the latest earnings. We cover that in our actionable full research report which you can read here, it’s free.