

Athletic apparel brand Nike (NYSE: NKE) reported revenue ahead of Wall Street’s expectations in Q2 CY2025, but sales fell by 12% year on year to $11.1 billion. Its GAAP profit of $0.14 per share was 13.5% above analysts’ consensus estimates.
Is now the time to buy Nike? Find out by accessing our full research report, it’s free.
Nike (NKE) Q2 CY2025 Highlights:
- Revenue: $11.1 billion vs analyst estimates of $10.73 billion (12% year-on-year decline, 3.4% beat)
- EPS (GAAP): $0.14 vs analyst estimates of $0.12 (13.5% beat)
- Operating Margin: 2.7%, down from 12.3% in the same quarter last year
- Constant Currency Revenue fell 9% year on year (0% in the same quarter last year)
- Market Capitalization: $89.78 billion
"While our financial results are in-line with our expectations, they are not where we want them to be. Moving forward, we expect our business to improve as a result of the progress we're making through our Win Now actions," said Elliott Hill, President & CEO, NIKE.
Company Overview
Originally selling Japanese Onitsuka Tiger sneakers as Blue Ribbon Sports, Nike (NYSE: NKE) is a global titan in athletic footwear, apparel, equipment, and accessories.
Revenue Growth
A company’s long-term sales performance can indicate its overall quality. Any business can experience short-term success, but top-performing ones enjoy sustained growth for years. Regrettably, Nike’s sales grew at a sluggish 4.4% compounded annual growth rate over the last five years. This fell short of our benchmark for the consumer discretionary sector and is a tough starting point for our analysis.
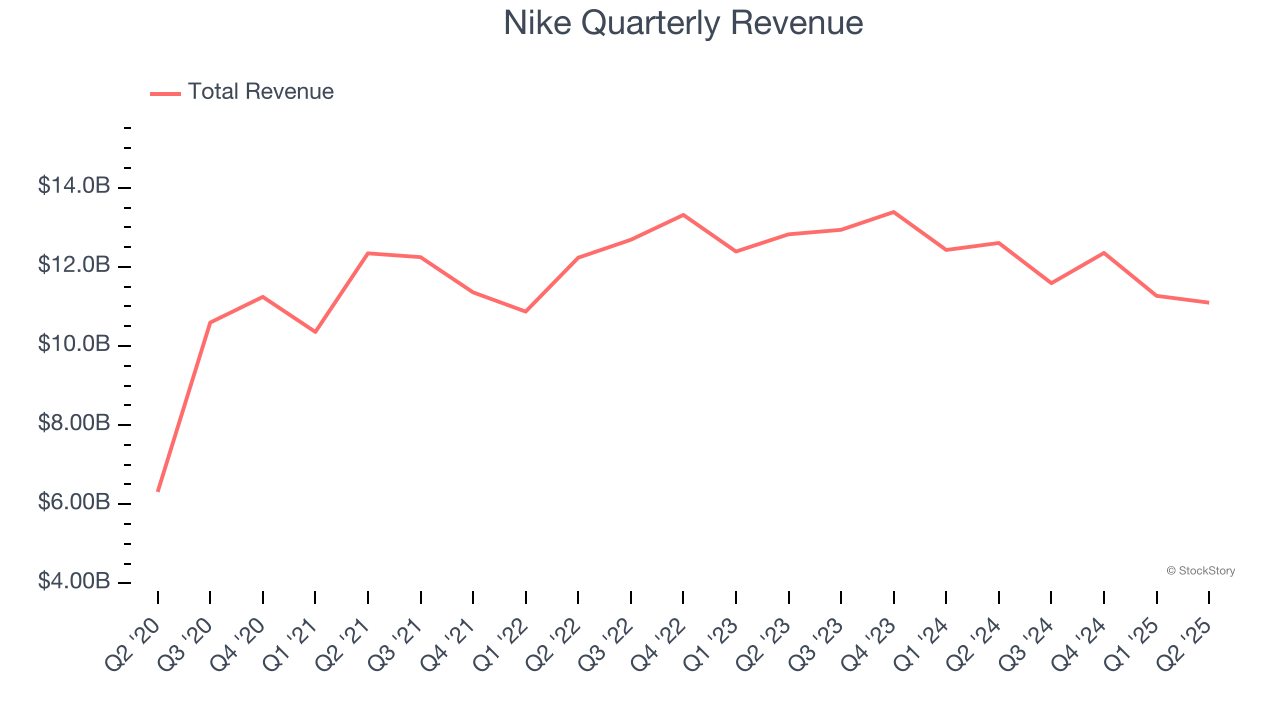
Long-term growth is the most important, but within consumer discretionary, product cycles are short and revenue can be hit-driven due to rapidly changing trends and consumer preferences. Nike’s performance shows it grew in the past but relinquished its gains over the last two years, as its revenue fell by 4.9% annually. 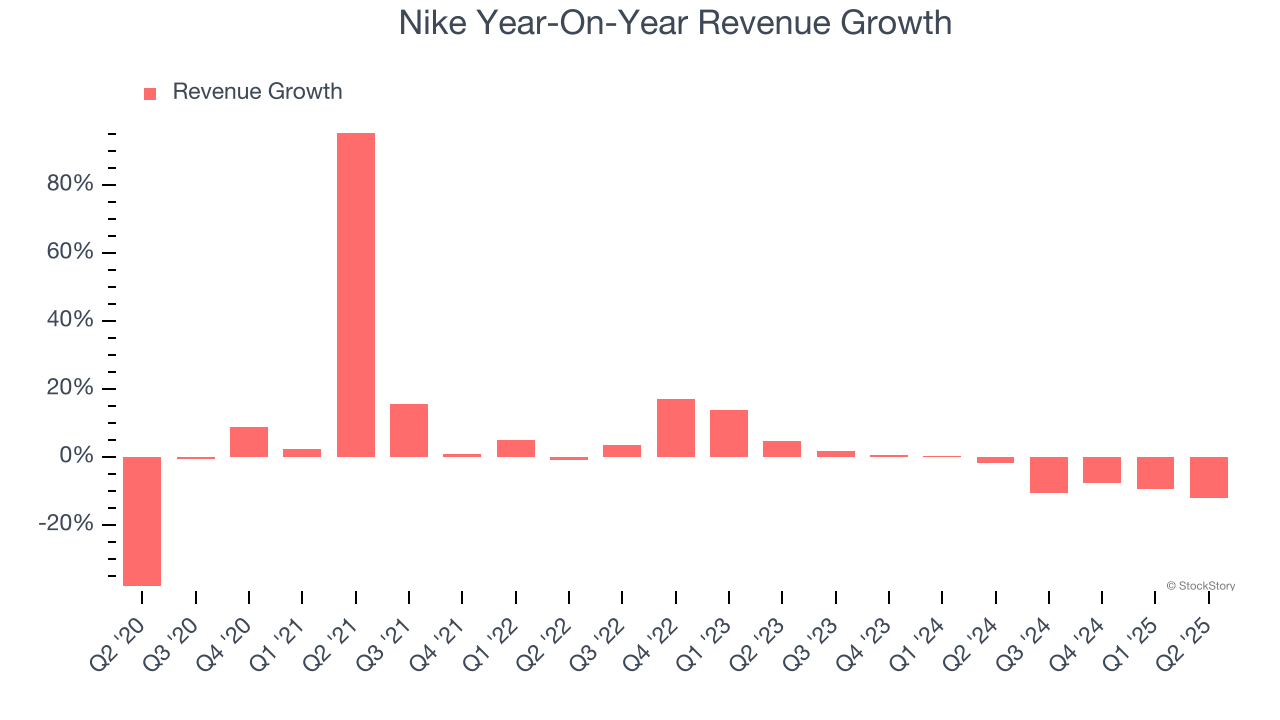
We can dig further into the company’s sales dynamics by analyzing its constant currency revenue, which excludes currency movements that are outside their control and not indicative of demand. Over the last two years, its constant currency sales averaged 4.1% year-on-year declines. Because this number aligns with its normal revenue growth, we can see that Nike has properly hedged its foreign currency exposure. 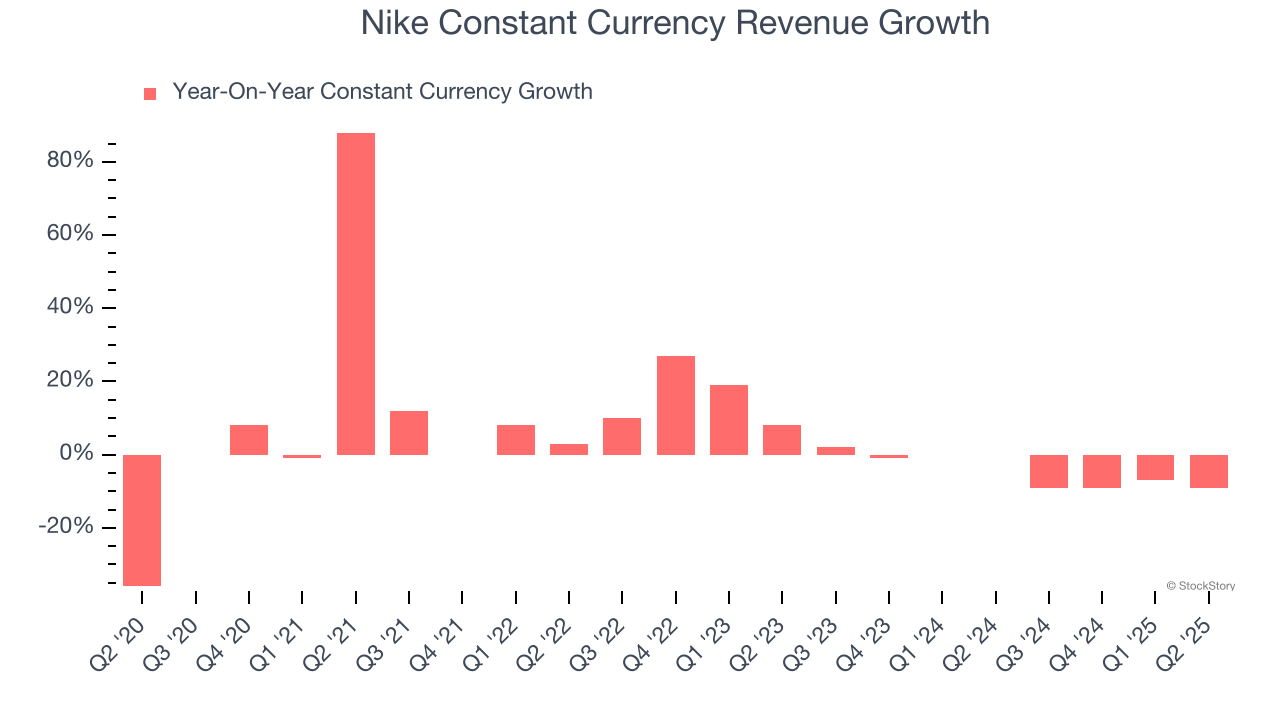
This quarter, Nike’s revenue fell by 12% year on year to $11.1 billion but beat Wall Street’s estimates by 3.4%.
Looking ahead, sell-side analysts expect revenue to decline by 2.5% over the next 12 months. Although this projection is better than its two-year trend, it’s hard to get excited about a company that is struggling with demand.
Here at StockStory, we certainly understand the potential of thematic investing. Diverse winners from Microsoft (MSFT) to Alphabet (GOOG), Coca-Cola (KO) to Monster Beverage (MNST) could all have been identified as promising growth stories with a megatrend driving the growth. So, in that spirit, we’ve identified a relatively under-the-radar profitable growth stock benefiting from the rise of AI, available to you FREE via this link.
Operating Margin
Operating margin is a key measure of profitability. Think of it as net income - the bottom line - excluding the impact of taxes and interest on debt, which are less connected to business fundamentals.
Nike’s operating margin has been trending down over the last 12 months, but it still averaged 10.2% over the last two years, decent for a consumer discretionary business. This shows it generally does a decent job managing its expenses.
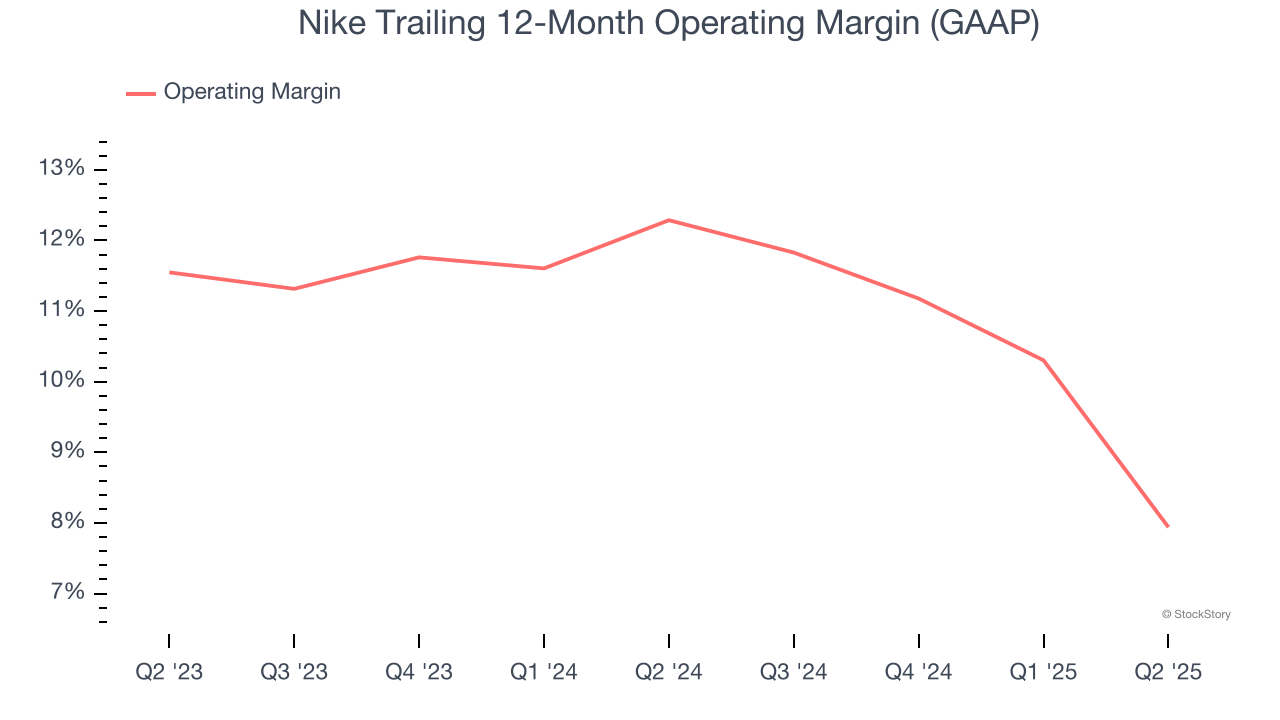
In Q2, Nike generated an operating margin profit margin of 2.7%, down 9.6 percentage points year on year. This contraction shows it was less efficient because its expenses increased relative to its revenue.
Earnings Per Share
Revenue trends explain a company’s historical growth, but the long-term change in earnings per share (EPS) points to the profitability of that growth – for example, a company could inflate its sales through excessive spending on advertising and promotions.
Nike’s EPS grew at an unimpressive 6.4% compounded annual growth rate over the last five years. On the bright side, this performance was better than its 4.4% annualized revenue growth and tells us the company became more profitable on a per-share basis as it expanded.
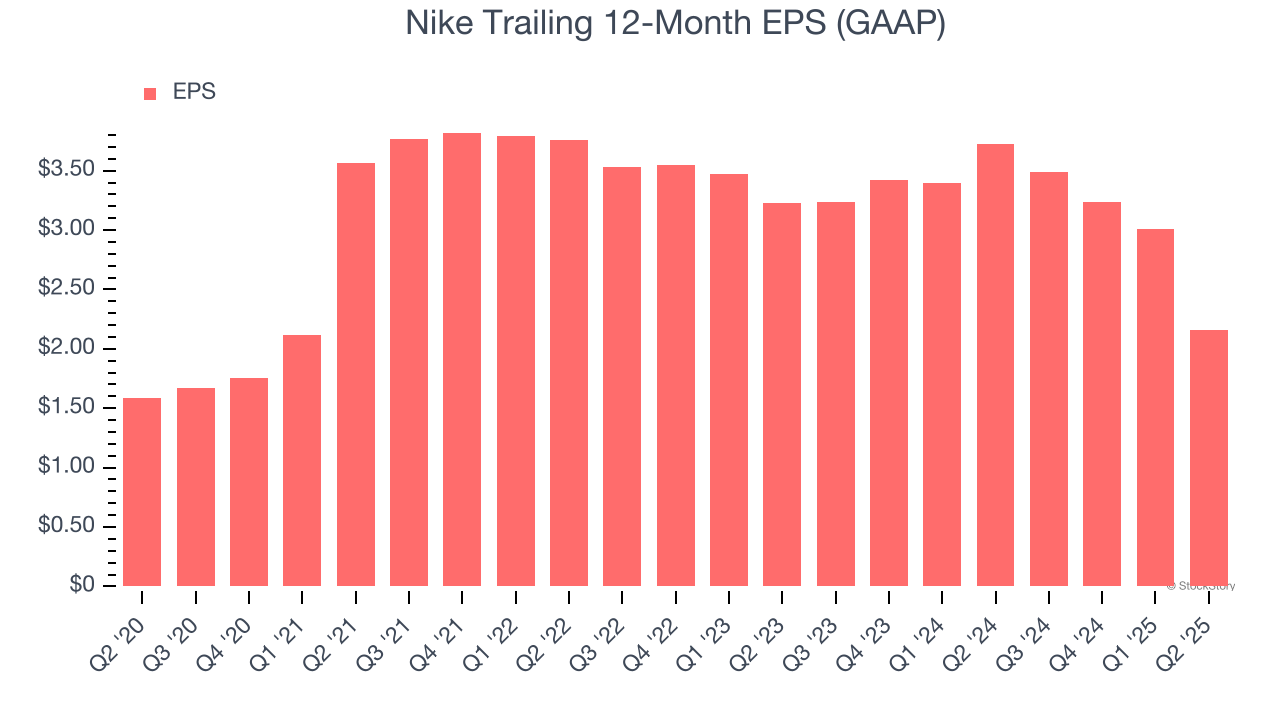
In Q2, Nike reported EPS at $0.14, down from $0.99 in the same quarter last year. Despite falling year on year, this print easily cleared analysts’ estimates. Over the next 12 months, Wall Street expects Nike’s full-year EPS of $2.16 to shrink by 21.8%.
Key Takeaways from Nike’s Q2 Results
We were impressed by how significantly Nike blew past analysts’ constant currency revenue expectations this quarter. We were also happy its EPS outperformed Wall Street’s estimates. Zooming out, we think this was a good print with some key areas of upside. The stock remained flat at $62.70 immediately after reporting.
Is Nike an attractive investment opportunity at the current price? The latest quarter does matter, but not nearly as much as longer-term fundamentals and valuation, when deciding if the stock is a buy. We cover that in our actionable full research report which you can read here, it’s free.


