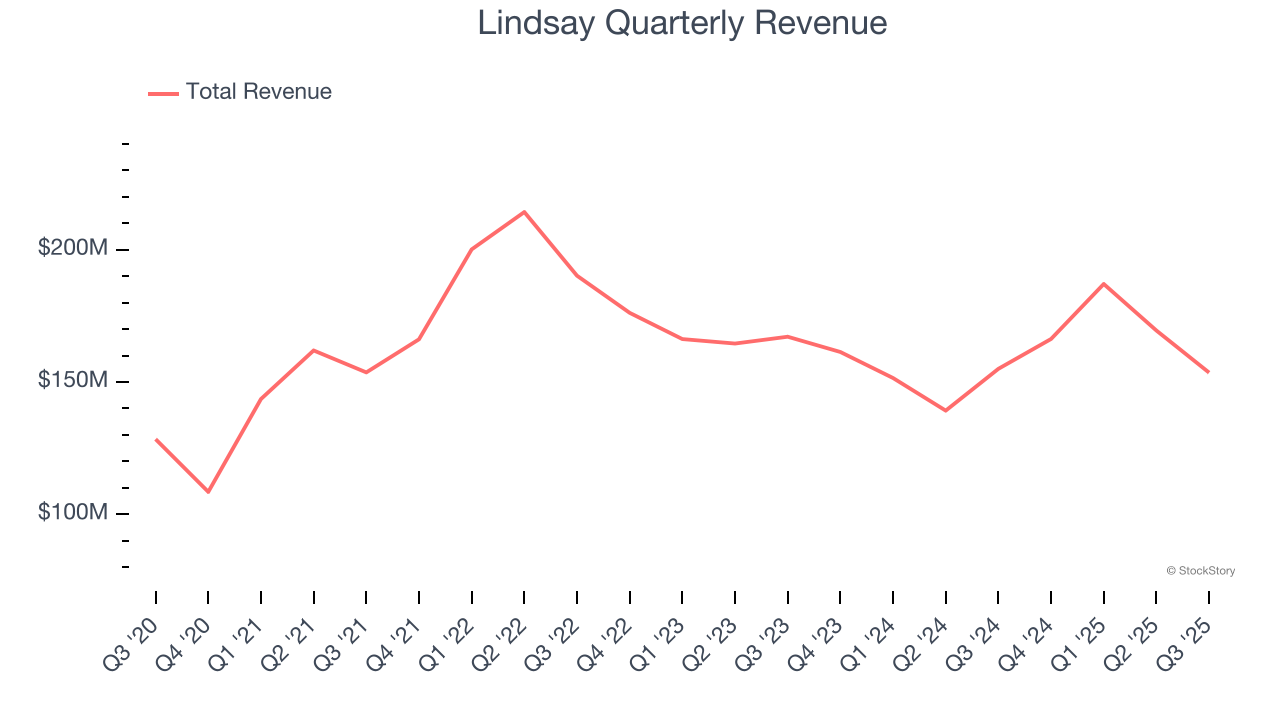
Agricultural and farm machinery company Lindsay (NYSE: LNN) reported Q3 CY2025 results exceeding the market’s revenue expectations, but sales were flat year on year at $153.6 million. Its GAAP profit of $0.99 per share was 10% below analysts’ consensus estimates.
Is now the time to buy Lindsay? Find out by accessing our full research report, it’s free for active Edge members.
Lindsay (LNN) Q3 CY2025 Highlights:
- Revenue: $153.6 million vs analyst estimates of $151.1 million (flat year on year, 1.6% beat)
- EPS (GAAP): $0.99 vs analyst expectations of $1.10 (10% miss)
- Operating Margin: 7.4%, down from 8.7% in the same quarter last year
- Free Cash Flow Margin: 32.4%, up from 30.7% in the same quarter last year
- Market Capitalization: $1.33 billion
“In the fourth quarter, our international irrigation business continued to deliver strong growth, led by marked improvement in South America and further supported by an increase in project revenues in the Middle East and North Africa (MENA) region," said Randy Wood, President and Chief Executive Officer.
Company Overview
A pioneer in the field of center pivot and lateral move irrigation, Lindsay (NYSE: LNN) provides a variety of proprietary water management and road infrastructure products and services.
Revenue Growth
A company’s long-term sales performance is one signal of its overall quality. Even a bad business can shine for one or two quarters, but a top-tier one grows for years. Regrettably, Lindsay’s sales grew at a mediocre 7.3% compounded annual growth rate over the last five years. This was below our standard for the industrials sector and is a poor baseline for our analysis.
Long-term growth is the most important, but within industrials, a half-decade historical view may miss new industry trends or demand cycles. Lindsay’s recent performance shows its demand has slowed as its revenue was flat over the last two years. We also note many other Agricultural Machinery businesses have faced declining sales because of cyclical headwinds. While Lindsay’s growth wasn’t the best, it did do better than its peers. 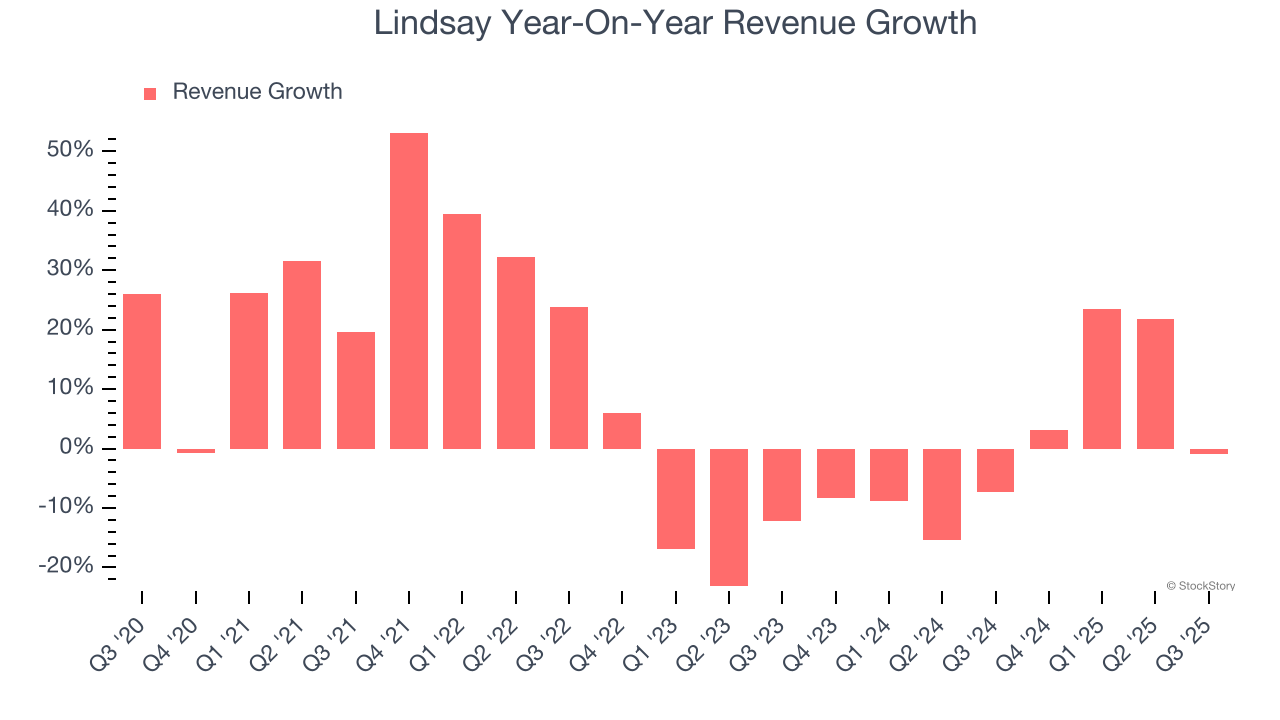
This quarter, Lindsay’s $153.6 million of revenue was flat year on year but beat Wall Street’s estimates by 1.6%.
Looking ahead, sell-side analysts expect revenue to decline by 2.4% over the next 12 months, a slight deceleration versus the last two years. This projection is underwhelming and suggests its products and services will see some demand headwinds.
Software is eating the world and there is virtually no industry left that has been untouched by it. That drives increasing demand for tools helping software developers do their jobs, whether it be monitoring critical cloud infrastructure, integrating audio and video functionality, or ensuring smooth content streaming. Click here to access a free report on our 3 favorite stocks to play this generational megatrend.
Operating Margin
Lindsay has been an efficient company over the last five years. It was one of the more profitable businesses in the industrials sector, boasting an average operating margin of 12.6%. This result was particularly impressive because of its low gross margin, which is mostly a factor of what it sells and takes huge shifts to move meaningfully. Companies have more control over their operating margins, and it’s a show of well-managed operations if they’re high when gross margins are low.
Looking at the trend in its profitability, Lindsay’s operating margin rose by 3.5 percentage points over the last five years, as its sales growth gave it operating leverage.
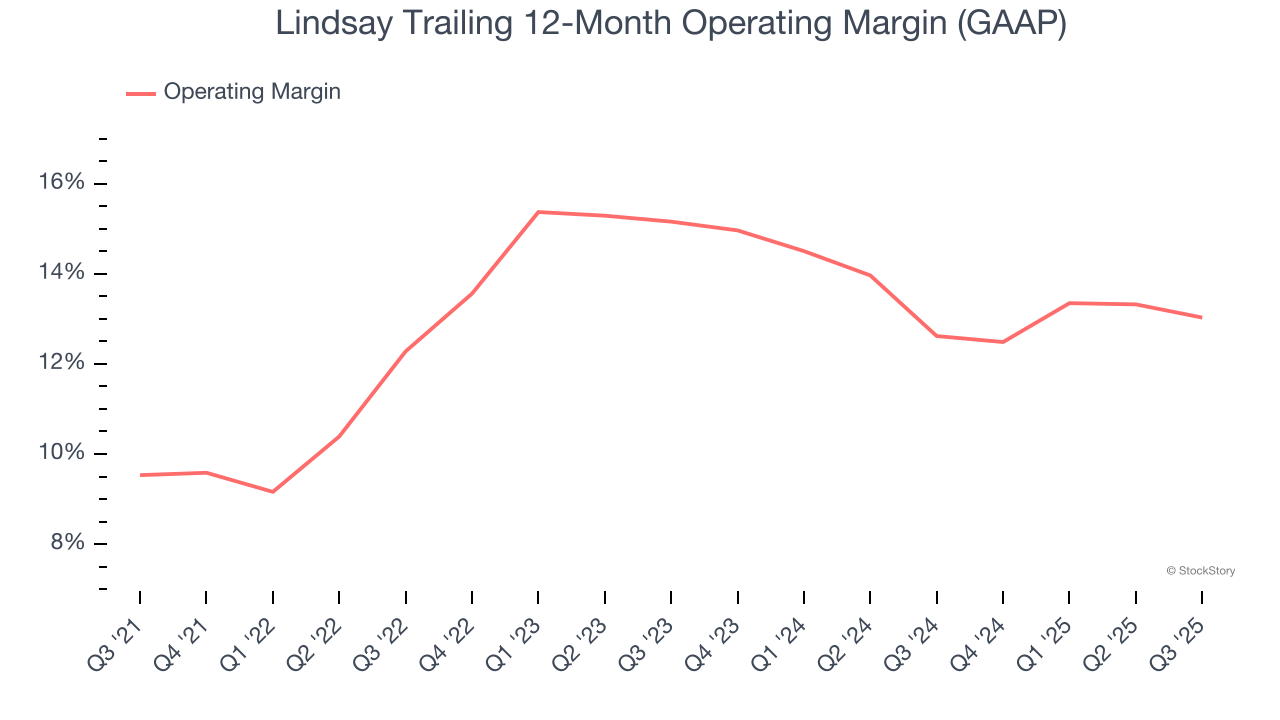
This quarter, Lindsay generated an operating margin profit margin of 7.4%, down 1.3 percentage points year on year. Since Lindsay’s operating margin decreased more than its gross margin, we can assume it was less efficient because expenses such as marketing, R&D, and administrative overhead increased.
Earnings Per Share
We track the long-term change in earnings per share (EPS) for the same reason as long-term revenue growth. Compared to revenue, however, EPS highlights whether a company’s growth is profitable.
Lindsay’s EPS grew at a remarkable 13.8% compounded annual growth rate over the last five years, higher than its 7.3% annualized revenue growth. This tells us the company became more profitable on a per-share basis as it expanded.
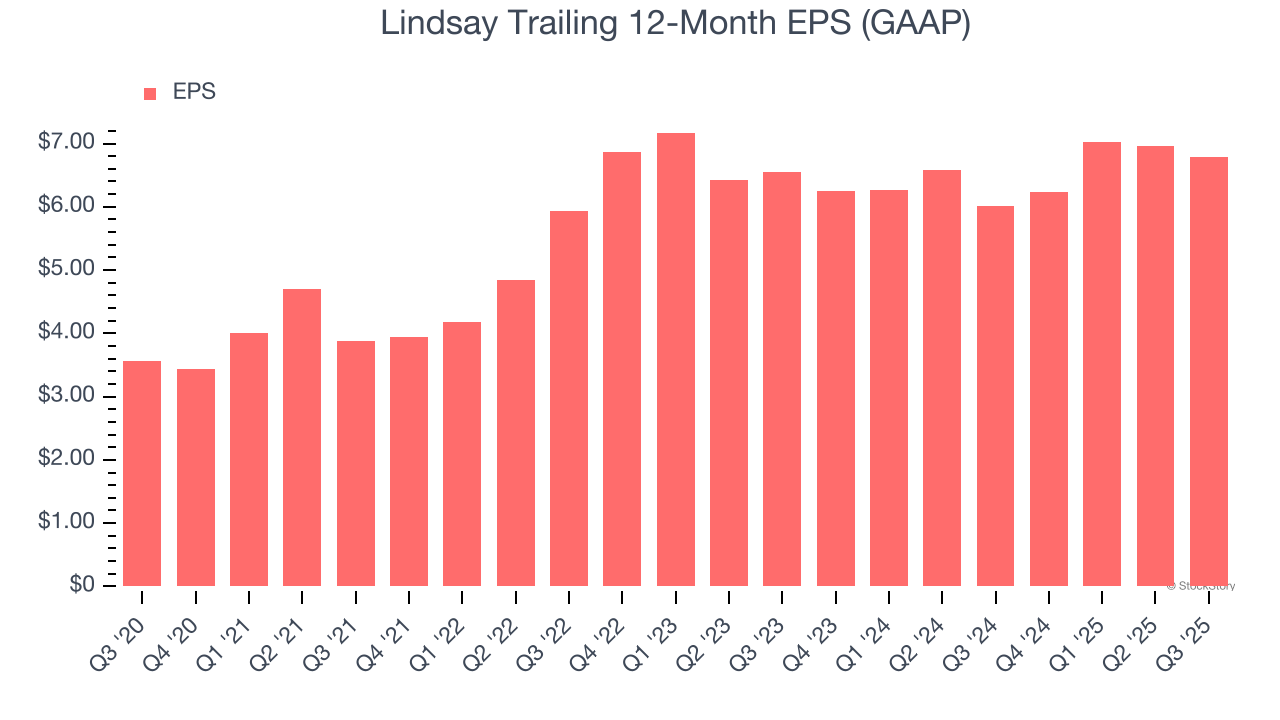
Diving into Lindsay’s quality of earnings can give us a better understanding of its performance. As we mentioned earlier, Lindsay’s operating margin declined this quarter but expanded by 3.5 percentage points over the last five years. This was the most relevant factor (aside from the revenue impact) behind its higher earnings; interest expenses and taxes can also affect EPS but don’t tell us as much about a company’s fundamentals.
Like with revenue, we analyze EPS over a shorter period to see if we are missing a change in the business.
For Lindsay, its two-year annual EPS growth of 1.8% was lower than its five-year trend. We hope its growth can accelerate in the future.
In Q3, Lindsay reported EPS of $0.99, down from $1.17 in the same quarter last year. This print missed analysts’ estimates, but we care more about long-term EPS growth than short-term movements. Over the next 12 months, Wall Street expects Lindsay’s full-year EPS of $6.78 to shrink by 7.3%.
Key Takeaways from Lindsay’s Q3 Results
It was encouraging to see Lindsay beat analysts’ revenue expectations this quarter. On the other hand, its operating margin fell compared to last year and EPS missed by a fairly large amount. Overall, this quarter could have been better. The stock traded down 5.1% to $116.36 immediately following the results.
The latest quarter from Lindsay’s wasn’t that good. One earnings report doesn’t define a company’s quality, though, so let’s explore whether the stock is a buy at the current price. If you’re making that decision, you should consider the bigger picture of valuation, business qualities, as well as the latest earnings. We cover that in our actionable full research report which you can read here, it’s free for active Edge members.