

Financial services company Bread Financial (NYSE: BFH) met Wall Street’s revenue expectations in Q3 CY2025, but sales fell by 1.2% year on year to $971 million. Its non-GAAP profit of $4.02 per share was 90.3% above analysts’ consensus estimates.
Is now the time to buy Bread Financial? Find out by accessing our full research report, it’s free for active Edge members.
Bread Financial (BFH) Q3 CY2025 Highlights:
- Net Interest Margin: 18.8% vs analyst estimates of 18.6% (20.2 basis point beat)
- Revenue: $971 million vs analyst estimates of $966.5 million (1.2% year-on-year decline, in line)
- Efficiency Ratio: 49% vs analyst estimates of 49.8% (77.2 basis point beat)
- Adjusted EPS: $4.02 vs analyst estimates of $2.11 (90.3% beat)
- Market Capitalization: $2.82 billion
Company Overview
Formerly known as Alliance Data Systems until its 2022 rebranding, Bread Financial (NYSE: BFH) provides credit cards, installment loans, and savings products to consumers while powering branded payment solutions for retailers and merchants.
Revenue Growth
Examining a company’s long-term performance can provide clues about its quality. Even a bad business can shine for one or two quarters, but a top-tier one grows for years. Over the last five years, Bread Financial grew its revenue at a sluggish 2.6% compounded annual growth rate. This fell short of our benchmarks and is a rough starting point for our analysis.
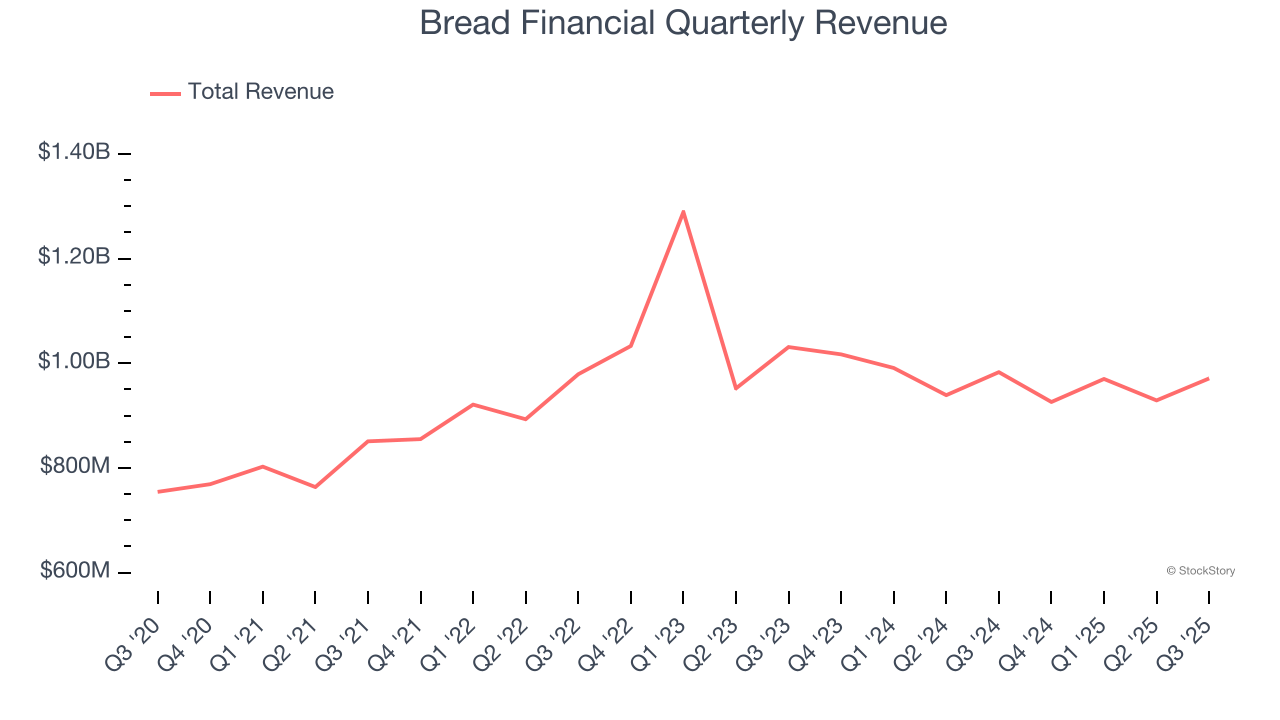
We at StockStory place the most emphasis on long-term growth, but within financials, a half-decade historical view may miss recent interest rate changes, market returns, and industry trends. Bread Financial’s performance shows it grew in the past but relinquished its gains over the last two years, as its revenue fell by 6.1% annually. 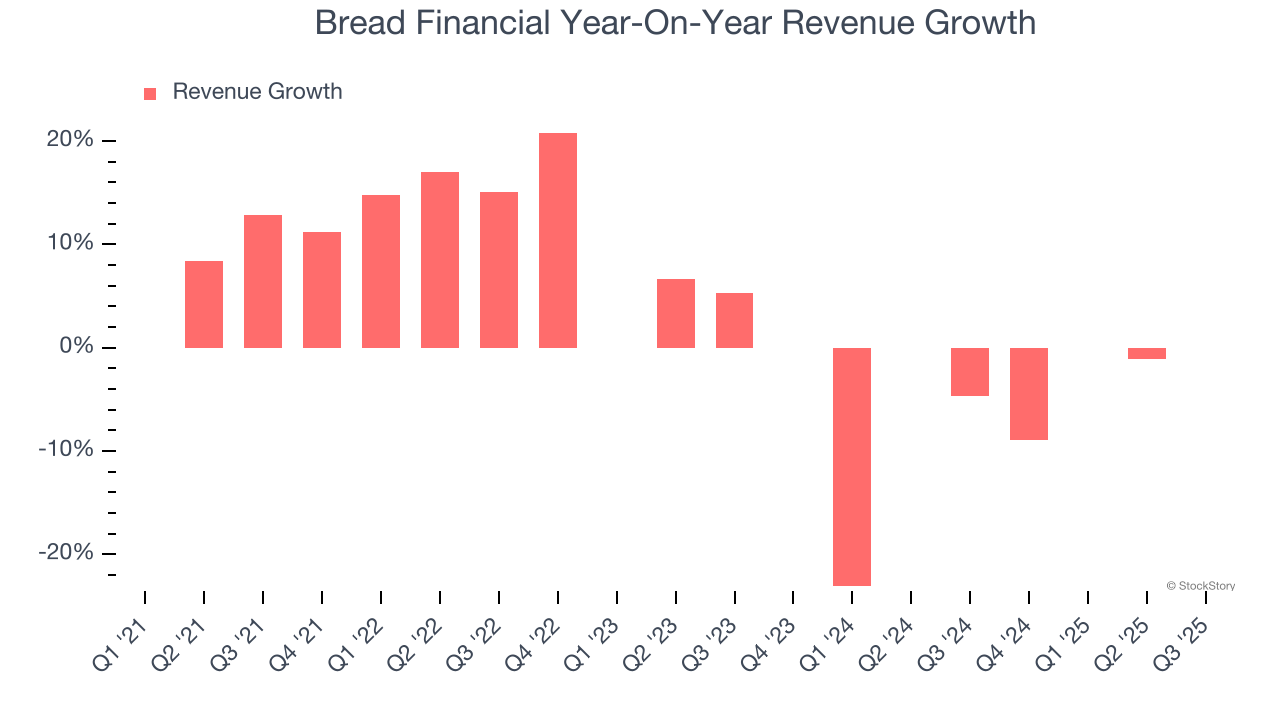 Note: Quarters not shown were determined to be outliers, impacted by outsized investment gains/losses that are not indicative of the recurring fundamentals of the business.
This quarter, Bread Financial reported a rather uninspiring 1.2% year-on-year revenue decline to $971 million of revenue, in line with Wall Street’s estimates.
Today’s young investors won’t have read the timeless lessons in Gorilla Game: Picking Winners In High Technology because it was written more than 20 years ago when Microsoft and Apple were first establishing their supremacy. But if we apply the same principles, then enterprise software stocks leveraging their own generative AI capabilities may well be the Gorillas of the future. So, in that spirit, we are excited to present our Special Free Report on a profitable, fast-growing enterprise software stock that is already riding the automation wave and looking to catch the generative AI next.
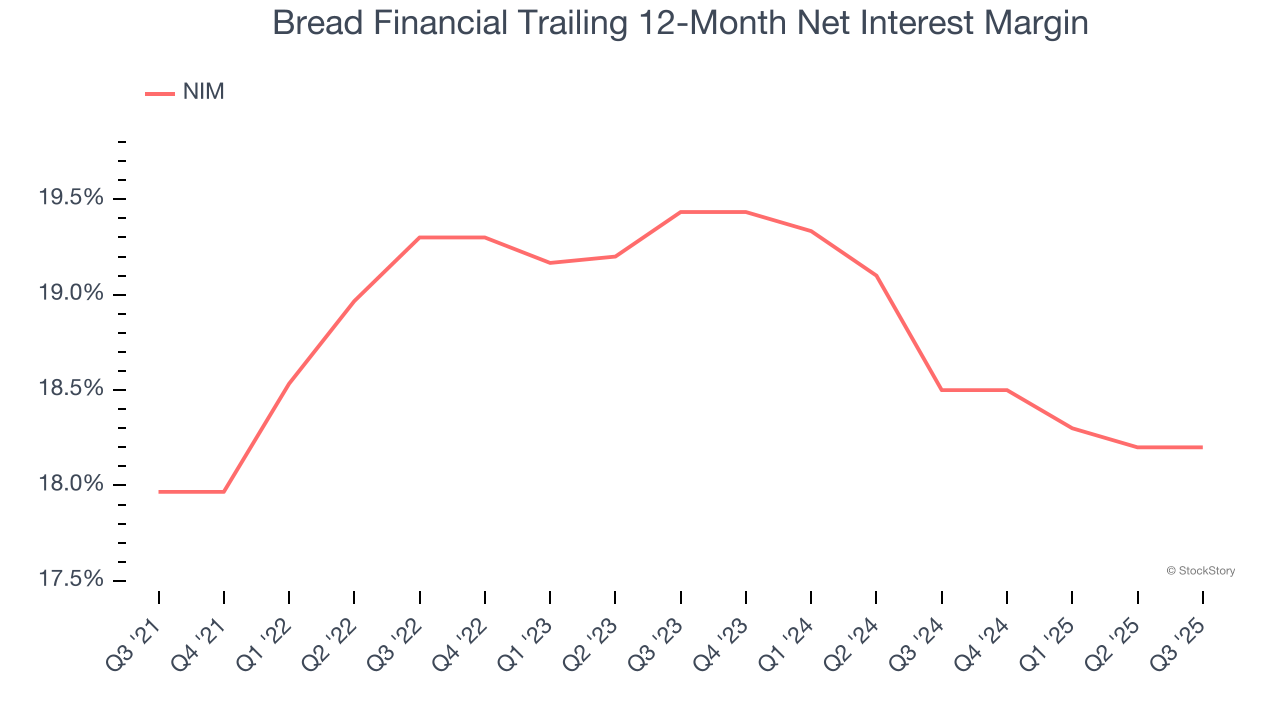
Net Interest Margin
The net interest margin (NIM) is a key profitability indicator that measures the difference between what a financial institution earns on its loans and what it pays on its deposits. This metric measures how efficiently one can generate income from its core lending activities.
Bread Financial’s net interest margin has increased by 23.3 basis points (100 basis points = 1 percentage point) over the last four years but decreased by 123.3 basis points on a two-year basis. These rates of change were worse than the broader financials industry. The firm’s NIM for the trailing 12 months was 18.2%.
Key Takeaways from Bread Financial’s Q3 Results
It was good to see Bread Financial beat analysts’ EPS expectations this quarter. We were also excited its net interest margin outperformed Wall Street’s estimates by a wide margin. On the other hand, its efficiency ratio missed. Zooming out, we think this quarter featured some important positives. The stock remained flat at $60.67 immediately following the results.
Indeed, Bread Financial had a rock-solid quarterly earnings result, but is this stock a good investment here? If you’re making that decision, you should consider the bigger picture of valuation, business qualities, as well as the latest earnings. We cover that in our actionable full research report which you can read here, it’s free for active Edge members.


