 Women’s handbag and fashion accessories brand Vera Bradley (NYSE: VRA) stock has stumbled (-48%) on the year. Business was impacted by inflationary pressures, logistics costs and rising fuel prices causing revenues to come in light in its fiscal Q1 2023 earnings. The Company suffered a net loss of (-$0.19) in the quarter. The macroeconomic pressures have mostly affected it’s under $55,000 income household customers, while higher-income households are spending more than the previous year. The Company is still expected to be profitable for the full-year fiscal 2023. With $2 cash-per-share and no long-term debt, Vera Bradley is in value territory. Vera Bradley implemented price increases in the quarter to offset some of the logistics and supply chain pressures which should start to show in the numbers in the latter part of the year. The epicenter travel industry is rapidly recovering, and Vera Bradley should be a benefactor of the revival of leisure travel. The Company is already optimizing for its important back-to-campus season with strategic product assortment enhancements. Prudent investors seeking exposure to a potential second-half comeback in the retail baggage and accessories segment can watch for opportunistic pullbacks in shares of Vera Bradley.
Q1 Fiscal 2023 Earnings Release
On June 8, 2022, Vera Bradley released its fiscal first-quarter fiscal 2023 results for the quarter ending April 2022. The Company reported an earnings-per-share (EPS) loss of (-$0.19) excluding non-recurring items versus consensus analyst estimates for a loss of (-$0.16), a (-$0.03) per share loss. Revenues fell (-9.7%) year-over-year (YoY) to $98.50 million, missing consensus analyst estimates for $109.87 million. Vera Bradley CEO Rob Wallstrom commented, “We are clearly seeing a bifurcation in the spending of our customer base. At Vera Bradley, Direct Channel full-line revenues were above last year as customers with higher household incomes remained engaged and spent more than last year. We also saw a healthy year-over-year rebound in Indirect Channel revenues. However, inflationary pressures, including rising gas prices, particularly impacted the spending of Vera Bradley full-line customers with household incomes below $55,000 as well as traffic and spending in our Vera Bradley Direct Channel factory stores for the quarter. In addition, Pura Vida’s ecommerce revenues continued to be significantly affected by the shift in social and digital media effectiveness and rising digital media costs. For the balance of the year, we are taking decisive actions to strengthen the enterprise and remain highly focused on our two core brands.”
Lowered Guidance
Vera Bradley issued downside guidance for fiscal 2023 EPS of $0.35 to $0.50 versus $0.61 consensus analyst estimates. Revenues are expected to come in between $490 million to $505 million versus $564.96 million.
Conference Call Takeaways
CEO Wallstrom acknowledged the weak performance but emphasized the price increases as a step towards mitigating logistics and sourcing pressures in addition to driving product innovations. The Company completed $10.5 million in share buybacks and maintained a clean debt-free balance sheet. He noted the bifurcation in its customer spending. Higher income households remained engaged and spent more money than last year, but the under $55,000 income households were impacted by rising interest rates, inflation, and gas prices. Pure Vida e-commerce is also seeing a significant shift in digital and social media effectiveness amid rising costs. While focus is on strengthening its two core brands, there will be a company-wide cost reduction and efficiency process to achieve $15 million to $25 million in annualized savings. They are also evolving the business model for Pure Vida from pure e-commerce to omnichannel with a diverse marketing base.
VRA Opportunistic Pullback Price Levels
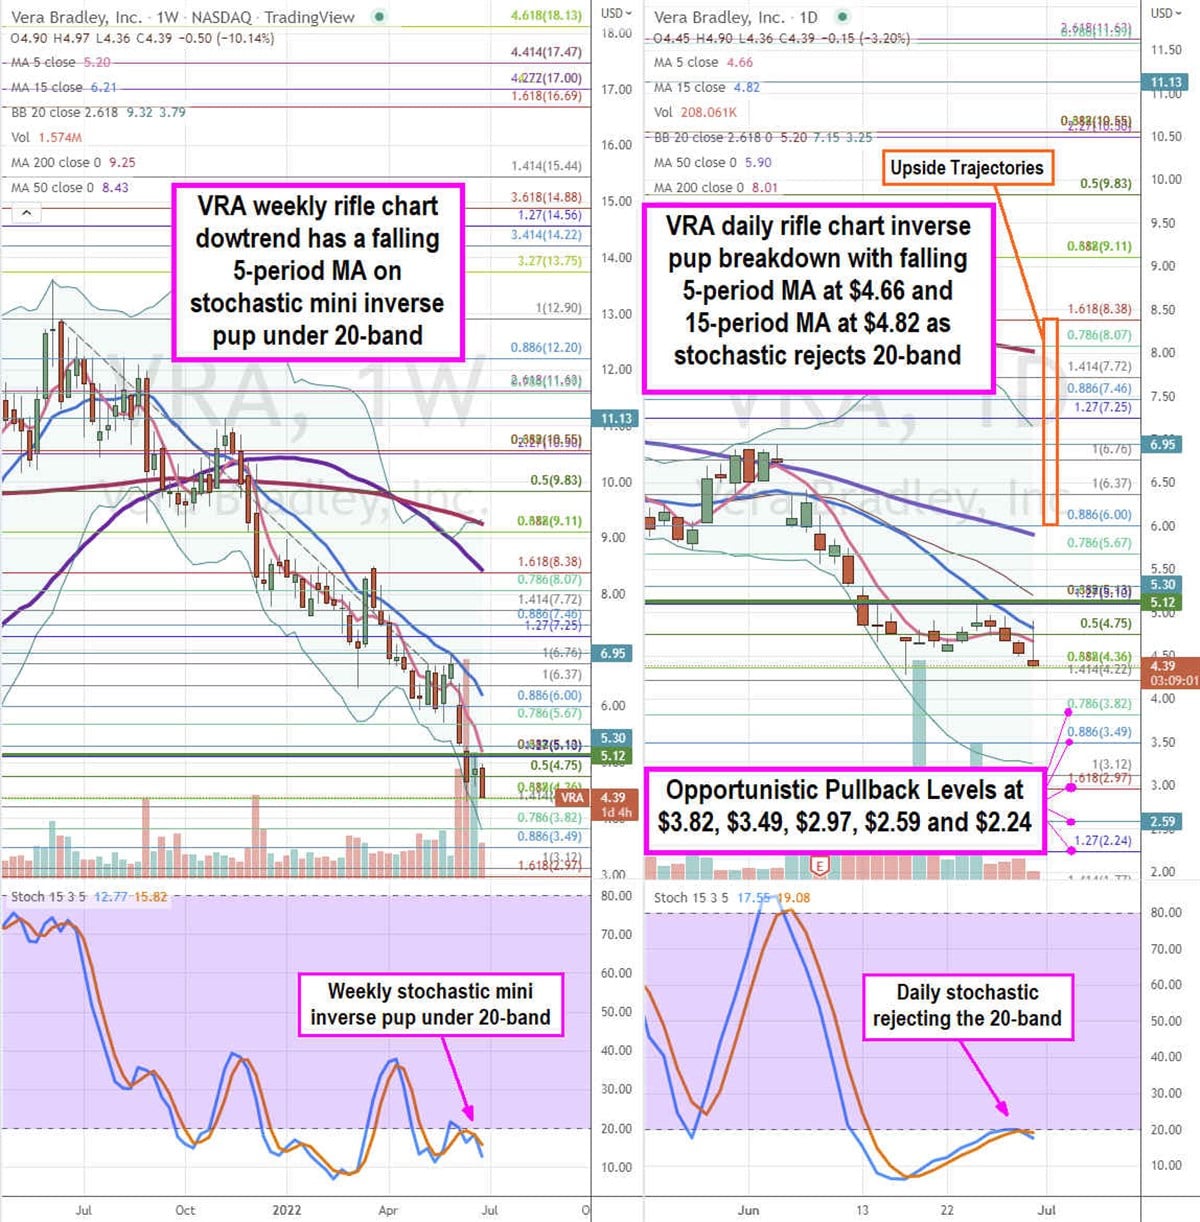
Using the rifle charts on the weekly and daily time frames provides a precision view of the landscape for VRA stock. The weekly rifle chart breakdown continues lower attempting to breakdown through the $4.39 Fibonacci (fib) level. The weekly stochastic formed a mini inverse pup slip on the 20-band rejection. The weekly 5-period moving average (MA) resistance is falling at $5.20 followed by the 15-period MA at $6.21. The weekly lower Bollinger Bands (BBs) sit near the $3.82 fib level. The weekly 50-period MA resistance sits at $8.43. The weekly market structure low (MSL) buy triggers on a breakout above $5.12. The daily rifle chart inverse pup breakdown has a falling 5-period MA at $4.66 and 15-period MA at $4.82. The daily stochastic is rejecting off the 20-band as its bounce attempt gets flushed back down. The daily lower BBs sit at $3.25. Opportunistic pullback levels sit at the $3.82 fib, $3.49 fib, $2.97 fib, $2.59, and the $2.24 fib level. Upside trajectories range from the $6.00 fib level up towards the $8.38 fib level.