FOMC Hikes Rates 0.75% And Market Cheers
The FOMC gave the market what it wanted and hiked rates by only 75 basis points despite indications inflation continues to run rampant. The FOMC also indicated a peak in interest rate hikes, which really got the market moving. The FOMC, which has been on top of inflation right from the start, is banking on inflation peaking as well but that is not what the evidence suggests. Not only did the latest CPI come in much hotter than expected but publicly traded companies from paint and glue makers to consumer staples are indicating additional price hikes in their earnings reports which means systemic inflation is still present and the inflationary cycle is not over.
The Outlook For S&P 500 Earnings Is Dimming
The Q2 earnings season is turning out better than expected but only in relation to the consensus estimates coming into the quarter. The blended rate of earning growth has risen about 80 basis points since the start of the season but this is a very narrow margin compared to past quarters. The S&P 500 (NYSEARCA: SPY) has beaten the estimates by a high double-digit figure since the pandemic began and this is the slowest pace of outperformance since even before the pandemic started. This indicates growth is not only priced into the market but also opens the door for underperformance in future quarters as inflationary pressures bite more deeply into the bottom line.
As for the outlook for earnings growth, while the Q2 period is outperforming the outlook for Q3, Q4, and 2023 are all in decline. The consensus outlook for Q3 and Q4 is down more than 200 basis points from the start of the season and the figures are expected to fall further. There are still about 45% of the S&P 500 left to report and include some of the most sensitive including many of the retail and consumer discretionary stocks.
In regard to a recession, the data indicates we are already in a recession whether it is official or not. The Q1 and Q2 GDP both came in negative, the Q2 GDP surprisingly so at -0.9% versus the 0.6% expected by economists, and the indications point to additional slowing. Not only is the FOMC still expected to hike by 50 basis points increments but the Index of Leading Indicators is negative and the pace of contraction has been accelerating. The latest read of the index has economic contraction at -0.9% in June which is down from the previous month’s downwardly revised -0.6%.
Oil And Labor Underpin Inflation
And underpinning inflation? The oil (NYSEARCA: USO) and the labor markets. The price of oil has come down from its peak but is still firmly above support at the $96 level and global supply/demand metrics are tilted in favor of higher prices. This means it is unlikely WTI will fall below $96 without a major, broad-based, contraction in activity and it will continue to cut into corporate earnings and consumer spending. On the labor end, wages continue to grow at a mid-single-digit pace YOY and growth accelerated over the past two months. Based on the number of jobs still available and the level of unemployment, that situation is unlikely to end even with a recession.
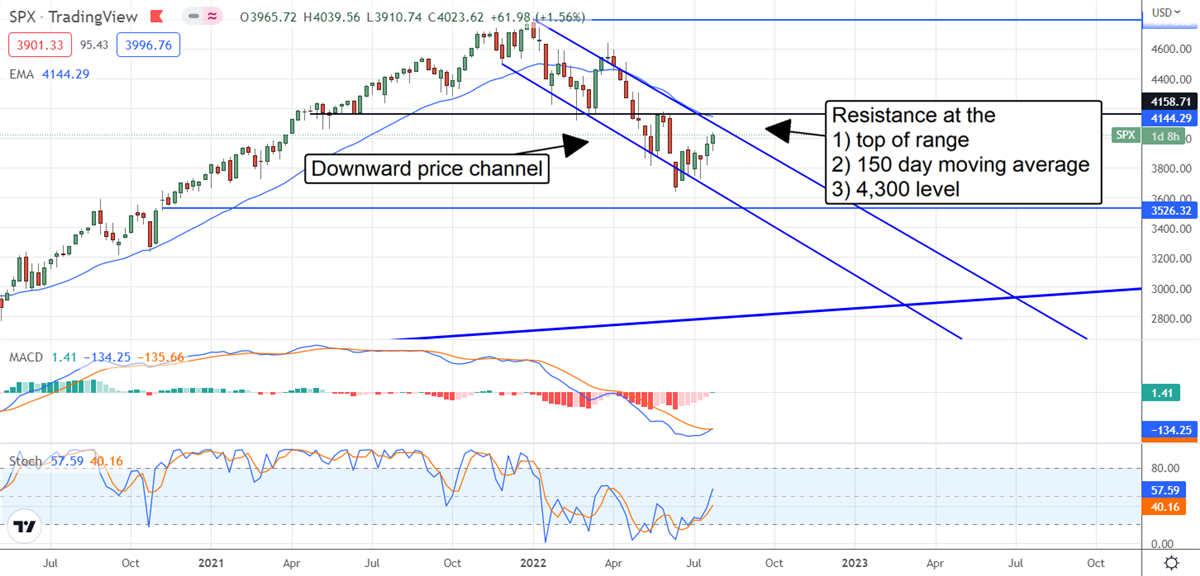
The Technical Outlook: The S&P 500 Bottomed Within Its Channel
The S&P 500 bottomed a month before the FOMC meeting but the rebound was accelerated by the policy announcement. The takeaways from the chart, however, are the bottom coincided with the bottom of a downward trending price channel, the price channel is still dominating the price action, and resistance at the top of the channel is close at hand. In this light, the rebound may continue to gain momentum but the market will most likely hit a wall near the 4,150 level and if not, there is another target for heavy resistance near 4,300. Assuming the economic and earnings outlook continues to soften the S&P 500 will most likely resume its downward trajectory and move back to the bottom of the channel and a target for support near 3,500.