
News of Nvidia’s (NVDA) latest partnership in the artificial intelligence (AI) food chain has hit the wires. Many investors, including an experienced commentator I heard on financial television on Monday, will admit to not knowing who Nvidia’s latest target even is.
But NVDA bought $2 billion of the company’s stock. So, does this lesser-known company have room to run?
Who and What Is Synopsys?
Synopsys (SNPS), the target company in this case, is not a newbie. In fact, it was one of the upstarts back in the dot-com bubble era.
Spoiler alert: It survived.
The company is now midway through its fourth decade and produces revenue of more than $6 billion annually. Its market capitalization is north of $75 billion, and it is a member of the Nasdaq-100 Index ($IUXX), the one tracked by popular ETFs like the Invesco QQQ ETF (QQQ).
The stock has lagged the tech sector severely over the past 12 months, as shown above. It was off 22%, which means NVDA certainly did not “top-tick” its purchase.
SNPS Gets a Shot in the Arm from NVDA Deal
SNPS sells at 43x trailing earnings and a similar multiple on forward-estimated profits for the coming year. Plus, it sells at nearly 5x its growth rate, so it is not a steal fundamentally.

So as I always do, let’s look at the charts for SNPS. To me, that’s where the clues typically reside. Because headlines and earnings reports can move a stock temporarily. However, what technicals do is put those moves into historical context.
Or, put another way, any stock can rise in price at any time. But what I am trying to find out is the degree of major risk attached to a stock or ETF at any point in time.
As I see it, we can all tag along in the bull markets. But to sidestep major downdrafts or even profit from anticipating them, using the charts for proactive risk management is the differentiator.
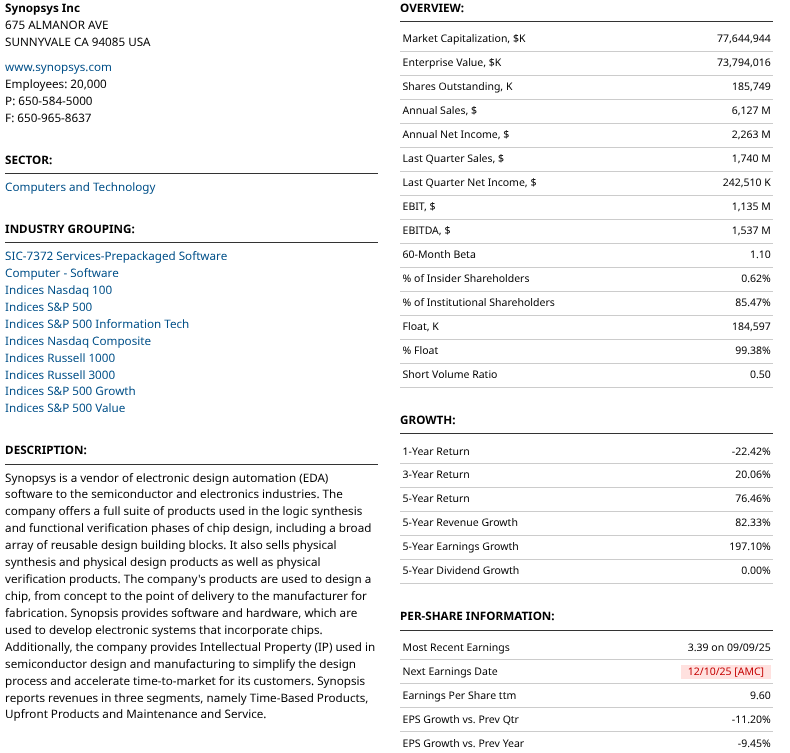
The daily view for SNPS looks like you’d expect. The stock price bounced, ending for now at a decline that took the stock from $650 all the way down below $400 a share. Since August!
Significantly, the stock traded down to the area where it bottomed in April’s tariff mess for the broad market. So this has been a rallying point twice before. That’s significant. The Percentage Price Oscillator (PPO) indicator is encouraging in that it is starting to rise, and about to make a higher high after flirting with a breakout last month. But that alone is not to be trusted given the news Monday. It could be a one-day wonder.
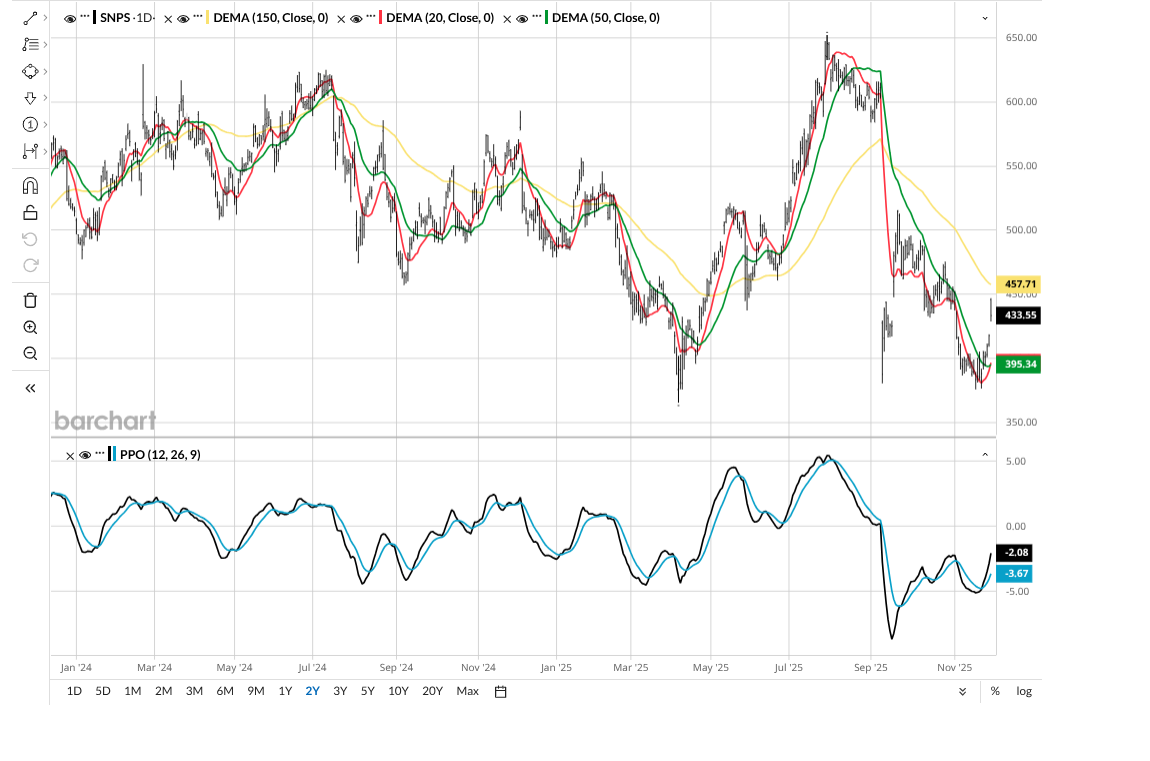
So, we look at the weekly chart. Here is where it gets very interesting to me. The stock’s downward momentum is potentially poised to reverse. I see that via the 20-week moving average and PPO.
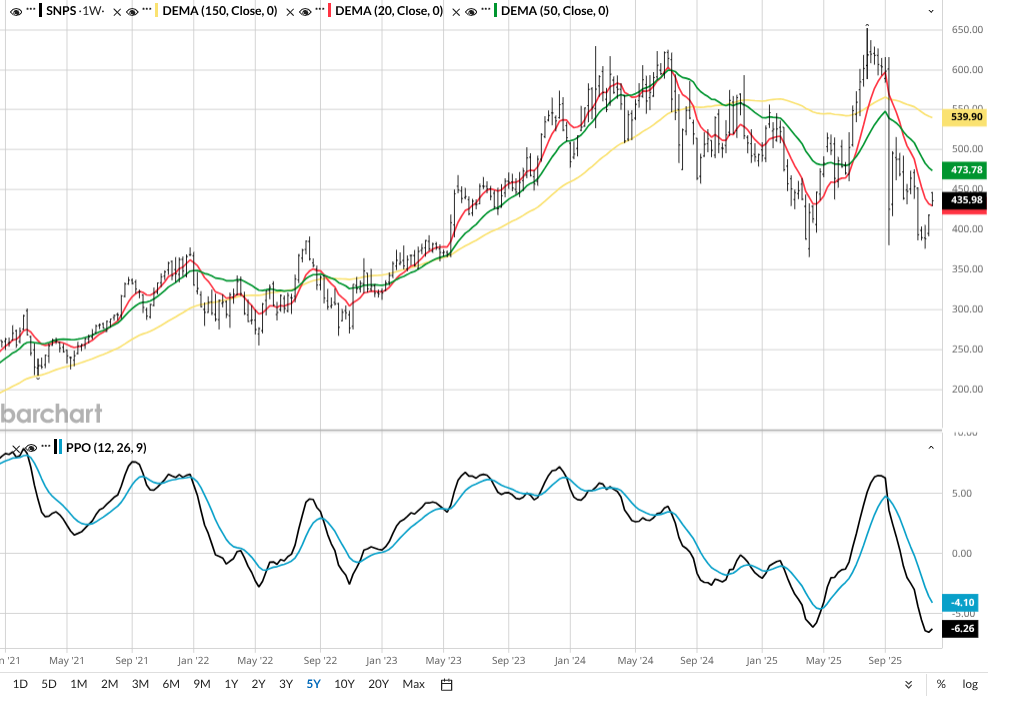
I pulled up the quarterly chart just to see if there was anything to be learned from this very long-term picture. I do that with stocks that go back a few decades, as this one does. Here, the only observation is a bearish one, albeit one that could take some time to develop.
I judge the PPO across multiple time frames, and in this very long-term version, that’s a very risky chart to me. It would take a big-time move over the shorter time frames to reverse that threat.
So what we have here in summary is:
- A newsworthy stock that just received a vote of confidence via NVDA’s investment.
- A stock that has been down on its luck, so to speak.
- A stock showing signs of coming back to life.
- But with a longer-term issue via the charts.
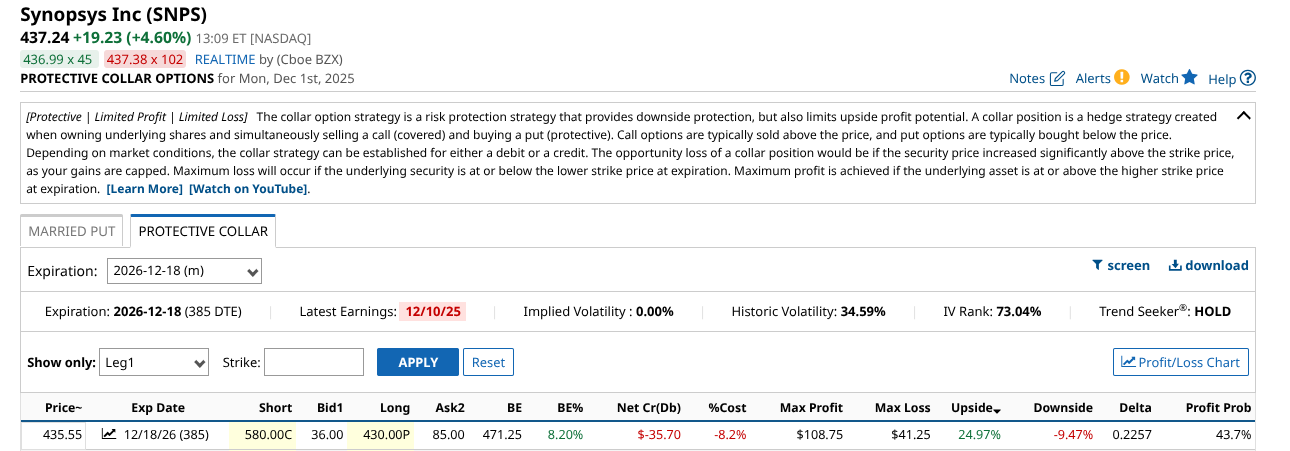
To me, this makes SNPS a very credible collar candidate. So here’s one example. I looked out a year and found a put struck at $430 and a call at $570. And at 25% max gain to under 10% max loss, that’s a 2.5:1 upside/downside, which is reasonable for a 12-month period.
NVDA has a penchant for doing these deals. I wonder if anyone will create an ETF containing all of the companies in its web of contracted deals. There are enough of them to create a whole portfolio at this point.
But in this AI-frenzied economy, I still think it is a good idea to look both ways.
On the date of publication, Rob Isbitts did not have (either directly or indirectly) positions in any of the securities mentioned in this article. All information and data in this article is solely for informational purposes. For more information please view the Barchart Disclosure Policy here.
More news from Barchart
- The Tesla Europe Sales Rout Keeps Going. Is It Time to Sell TSLA Stock?
- Dear Nuclear Energy Stocks Fans, Mark Your Calendars for December 3
- Nvidia Just Lit a Fire Under Synopsys Stock But Its Chart Is Waving Red Flags. Here’s the Only Way I’d Trade SNPS Here.
- How Micron Stock Could Be an Even Bigger Winner Than GOOGL from a Google-Meta Deal


