
Parsley Energy, Inc. is an oil and natural gas company, which engages in the acquisition, development and exploitation of unconventional oil and natural gas reserves. Its portfolio includes Midland and Southern Delaware basin.
Take a look at the 1-year chart of Parsley (NYSE: PE) below with my added notations:
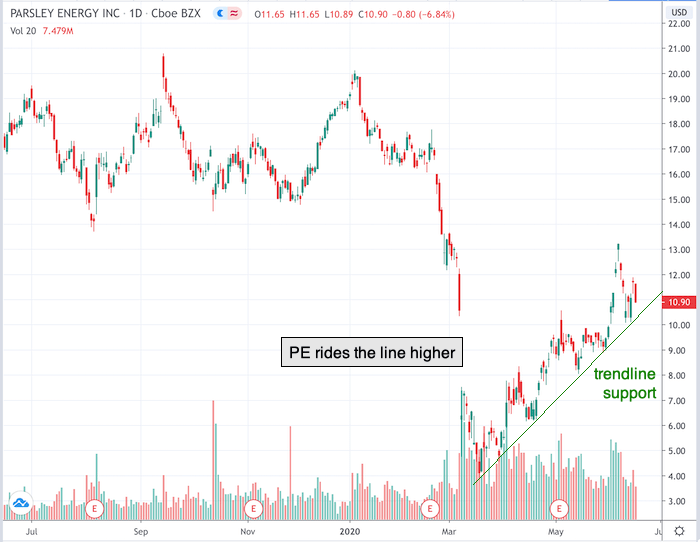
Over the past three months, PE has been trending higher, while also forming a nice trend line of support (green) along the way. Always remember that any (2) points can start a trend line, but it’s the 3rd test and beyond that confirm its relevance. A pullback to the PE line provides trading opportunities, one way or another.
The Tale of the Tape: PE has formed a trend line of support. A long position could be entered on a pullback to the trendline, with a stop placed below the level of entry. A short position could be entered if PE were to break below its trendline.
Before making any trading decision, decide which side of the trade you believe gives you the highest probability of success. Do you prefer the short side of the market, long side, or do you want to be in the market at all? If you haven’t thought about it, review the overall indices themselves. For example, take a look at the S&P 500. Is it trending higher or lower? Has it recently broken through a key resistance or support level? Making these decisions ahead of time will help you decide which side of the trade you believe gives you the best opportunities.
No matter what your strategy or when you decide to enter, always remember to use protective stops and you’ll be around for the next trade. Capital preservation is always key!
Good luck!
Christian Tharp, CMT
@cmtstockcoach
Want More Great Investing Ideas?
Do NOT Buy This Dip! Are you prepared for the bear market’s return?
7 “Safe-Haven” Dividend Stocks for Turbulent Times
9 “BUY THE DIP” Growth Stocks for 2020
PE shares were trading at $11.09 per share on Thursday morning, up $0.19 (+1.74%). Year-to-date, PE has declined -40.83%, versus a -2.71% rise in the benchmark S&P 500 index during the same period.
About the Author: Christian Tharp

Christian is an expert stock market coach at the Adam Mesh Trading Group who has mentored more than 4,000 traders and investors. He is a professional technical analyst that is a certified Chartered Market Technician (CMT), which is a designation awarded by the CMT Association. Christian is also the author of the daily online newsletter Todays Big Stock.
The post Chart of the Day: Parsley Energy (PE) appeared first on StockNews.com