

CoreLogic® (NYSE: CLGX), a leading global property information, analytics and data-enabled solutions provider, today released the Home Equity Report for the second quarter of 2019. The report shows that U.S. homeowners with mortgages (which account for roughly 63% of all properties) have seen their equity increase by 4.8% year over year, representing a gain of nearly $428 billion since the second quarter of 2018.
This press release features multimedia. View the full release here: https://www.businesswire.com/news/home/20190920005080/en/
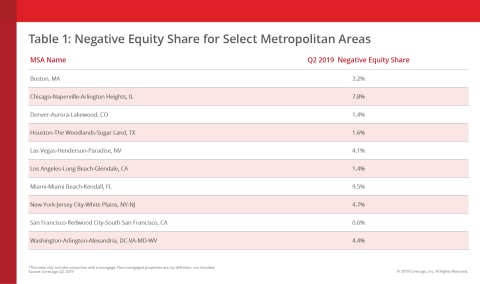
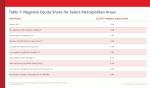
Negative Equity Share for Select Metropolitan Areas (Graphic: Business Wire)
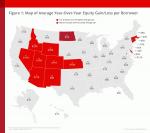
The average homeowner gained $4,900 in home equity between the second quarter of 2018 and the second quarter of 2019. States that saw the largest gains include Idaho, where homeowners gained an average of $22,100; Wyoming, where homeowners gained an average of $20,400; and Nevada, where homeowners gained an average of $16,800 (Figure 1).
From the first quarter of 2019 to the second quarter of 2019, the total number of mortgaged homes in negative equity decreased by 7% to 2 million homes or 3.8% of all mortgaged properties. The number of mortgaged properties in negative equity during the second quarter of 2019 fell by 9%, or 151,000 homes, compared to the second quarter of 2018 when 2.2 million homes, or 4.3% of all mortgaged properties, were in negative equity.
“Borrower equity rose to an all-time high in the first half of 2019 and has more than doubled since the housing recovery started,” said Dr. Frank Nothaft, chief economist for CoreLogic. “Combined with low mortgage rates, this rise in home equity supports spending on home improvements and may help improve balance sheets of households who could take out home equity loans to consolidate their debt.”
Negative equity, often referred to as being underwater or upside down, applies to borrowers who owe more on their mortgages than their homes are worth. Negative equity can occur because of a decline in a home’s value, an increase in mortgage debt or both. Negative equity peaked at 26% of mortgaged residential properties in the fourth quarter of 2009, based on the CoreLogic equity data analysis, which began in the third quarter of 2009.
The national aggregate value of negative equity was approximately $302.7 billion at the end of the second quarter of 2019. This is down quarter over quarter by approximately $2.6 billion, or 0.8%, from $305.3 billion in the first quarter of 2019 and up year over year by approximately $21 billion, or 7.5%, from $281.7 billion in the second quarter of 2018.
"Home values have continued to rise in most parts of the country this year and we are seeing the benefit in higher home equity levels. The western half of the U.S. has experienced particularly strong gains in home equity recently," said Frank Martell, president and CEO of CoreLogic. "In July 2019, South Dakota and Connecticut were the only two states to post annual home price declines. These losses mirror the states' home equity performances during the second quarter as both reported negative home equity gains per borrower."
For ongoing housing trends and data, visit the CoreLogic Insights Blog: www.corelogic.com/insights-index.aspx.
Methodology
The amount of equity for each property is determined by comparing the estimated current value of the property against the mortgage debt outstanding (MDO). If the MDO is greater than the estimated value, then the property is determined to be in a negative equity position. If the estimated value is greater than the MDO, then the property is determined to be in a positive equity position. The data is first generated at the property level and aggregated to higher levels of geography. CoreLogic data includes more than 50 million properties with a mortgage, which accounts for more than 95% of all mortgages in the U.S. CoreLogic uses public record data as the source of the MDO, which includes both first-mortgage liens and second liens, and is adjusted for amortization and home equity utilization in order to capture the true level of MDO for each property. The calculations are not based on sampling, but rather on the full data set to avoid potential adverse selection due to sampling. The current value of the property is estimated using a suite of proprietary CoreLogic valuation techniques, including valuation models and the CoreLogic Home Price Index (HPI). In August 2016, the CoreLogic HPI was enhanced to include nearly one million additional repeat sales records from proprietary data sources that provide greater coverage in home price changes nationwide. The increased coverage is particularly useful in 14 non-disclosure states. Additionally, a new modeling methodology has been added to the HPI to weight outlier pairs, ensuring increased consistency and reducing month-over-month revisions. The use of the enhanced CoreLogic HPI was implemented with the Q2 2016 Equity report. Only data for mortgaged residential properties that have a current estimated value are included. There are several states or jurisdictions where the public record, current value or mortgage data coverage is thin and have been excluded from the analysis. These instances account for fewer than 5% of the total U.S. population. The percentage of homeowners with a mortgage is from the 2016 American Community Survey. Fourth quarter of 2017 data was revised. Revisions with public records data are standard, and to ensure accuracy, CoreLogic incorporates the newly released public data to provide updated results.
Source: CoreLogic
The data provided is for use only by the primary recipient or the primary recipient's publication or broadcast. This data may not be re-sold, republished or licensed to any other source, including publications and sources owned by the primary recipient's parent company without prior written permission from CoreLogic. Any CoreLogic data used for publication or broadcast, in whole or in part, must be sourced as coming from CoreLogic, a data and analytics company. For use with broadcast or web content, the citation must directly accompany first reference of the data. If the data is illustrated with maps, charts, graphs or other visual elements, the CoreLogic logo must be included on screen or website. For questions, analysis or interpretation of the data, contact Todd Taylor at newsmedia@corelogic.com or Allyse Sanchez at corelogic@ink-co.com. Data provided may not be modified without the prior written permission of CoreLogic. Do not use the data in any unlawful manner. This data is compiled from public records, contributory databases and proprietary analytics, and its accuracy depends upon these sources.
About CoreLogic
CoreLogic (NYSE: CLGX), the leading provider of property insights and solutions, promotes a healthy housing market and thriving communities. Through its enhanced property data solutions, services and technologies, CoreLogic enables real estate professionals, financial institutions, insurance carriers, government agencies and other housing market participants to help millions of people find, acquire and protect their homes. For more information, please visit www.corelogic.com.
CORELOGIC and the CoreLogic logo are trademarks of CoreLogic, Inc. and/or its subsidiaries. All other trademarks are the property of their respective owners.
View source version on businesswire.com: https://www.businesswire.com/news/home/20190920005080/en/
Contacts:
Sr. Leader, Marketing
619-938-6829
newsmedia@corelogic.com
