Electronic products manufacturer AMETEK (NYSE: AME) reported Q4 CY2025 results exceeding the market’s revenue expectations, with sales up 13.4% year on year to $2.00 billion. The company expects next quarter’s revenue to be around $1.91 billion, close to analysts’ estimates. Its non-GAAP profit of $2.01 per share was 3.4% above analysts’ consensus estimates.
Is now the time to buy AMETEK? Find out by accessing our full research report, it’s free.
AMETEK (AME) Q4 CY2025 Highlights:
- Revenue: $2.00 billion vs analyst estimates of $1.95 billion (13.4% year-on-year growth, 2.6% beat)
- Adjusted EPS: $2.01 vs analyst estimates of $1.94 (3.4% beat)
- Revenue Guidance for Q1 CY2026 is $1.91 billion at the midpoint, roughly in line with what analysts were expecting
- Adjusted EPS guidance for the upcoming financial year 2026 is $7.97 at the midpoint, in line with analyst estimates
- Operating Margin: 25.3%, down from 26.6% in the same quarter last year
- Free Cash Flow Margin: 26.4%, down from 28.3% in the same quarter last year
- Market Capitalization: $52.42 billion
"AMETEK's fourth quarter and full year results were outstanding," stated David A. Zapico, AMETEK Chairman and Chief Executive Officer.
Company Overview
Started from its humble beginnings in motor repair, AMETEK (NYSE: AME) manufactures electronic devices used in industries like aerospace, power, and healthcare.
Revenue Growth
A company’s long-term performance is an indicator of its overall quality. Any business can put up a good quarter or two, but the best consistently grow over the long haul. Luckily, AMETEK’s sales grew at a solid 10.3% compounded annual growth rate over the last five years. Its growth beat the average industrials company and shows its offerings resonate with customers.
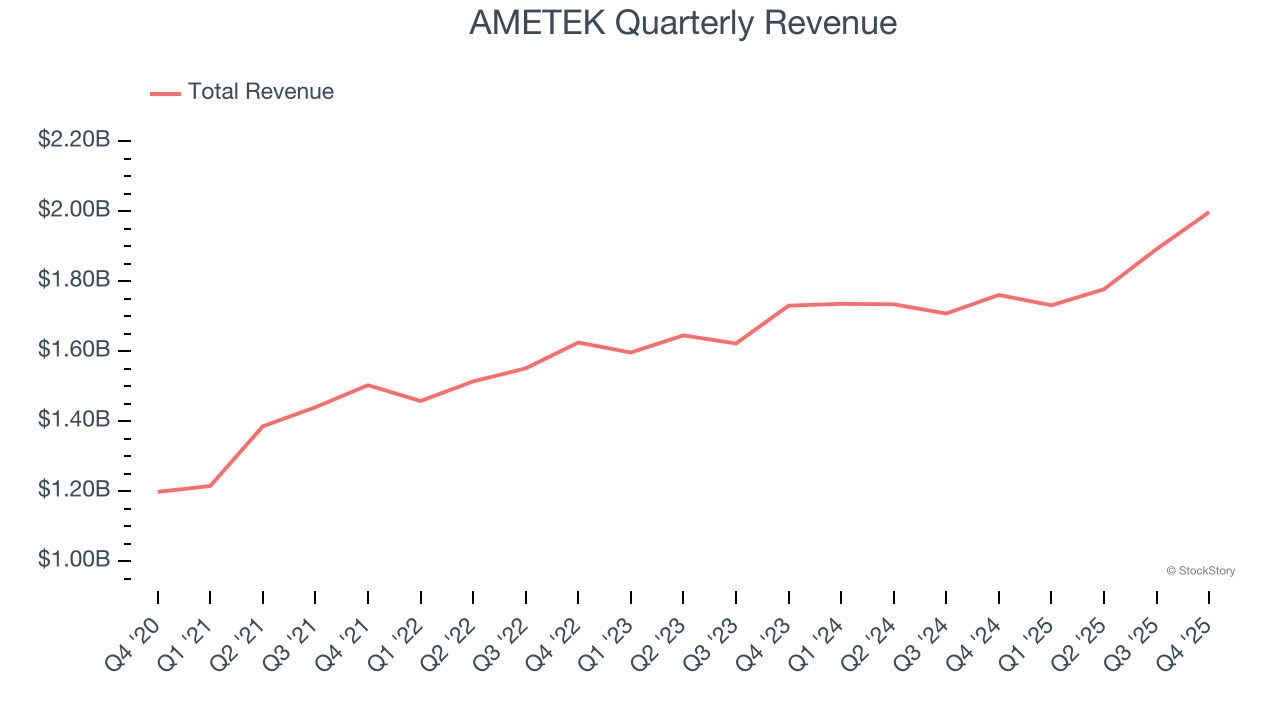
Long-term growth is the most important, but within industrials, a half-decade historical view may miss new industry trends or demand cycles. AMETEK’s recent performance shows its demand has slowed as its annualized revenue growth of 5.9% over the last two years was below its five-year trend. 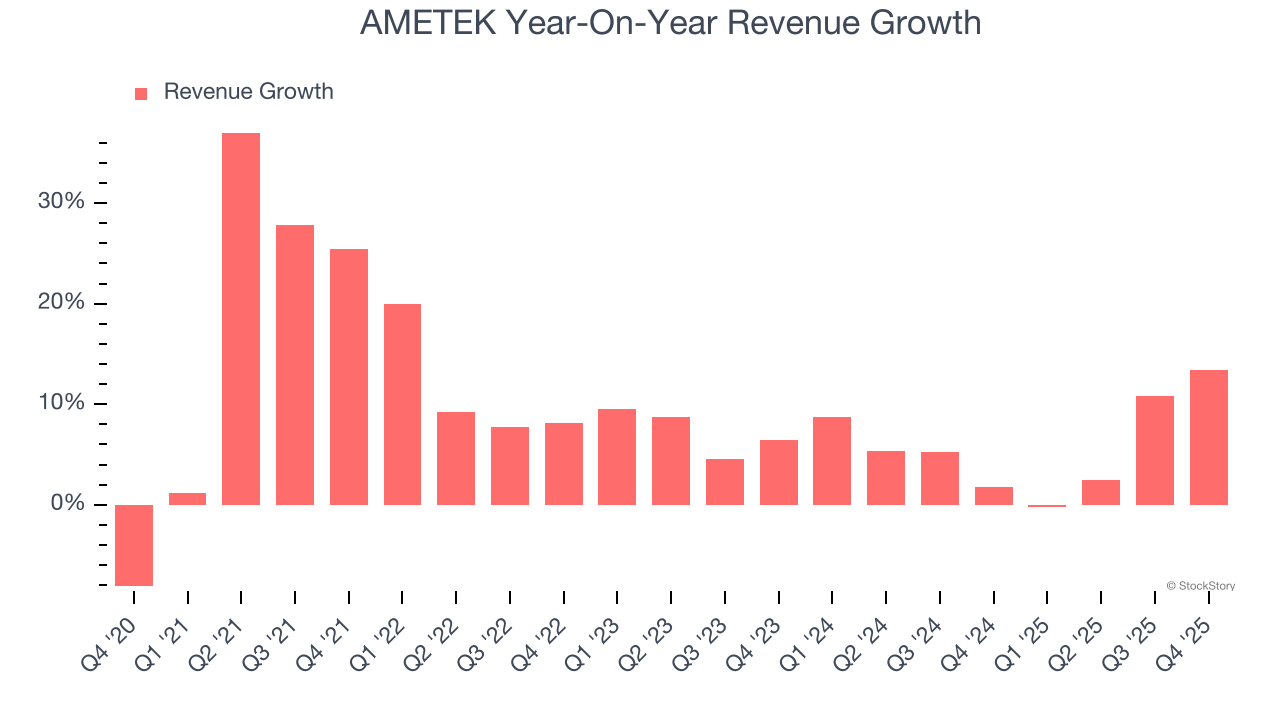
This quarter, AMETEK reported year-on-year revenue growth of 13.4%, and its $2.00 billion of revenue exceeded Wall Street’s estimates by 2.6%. Company management is currently guiding for a 10% year-on-year increase in sales next quarter.
Looking further ahead, sell-side analysts expect revenue to grow 6.8% over the next 12 months, similar to its two-year rate. This projection is underwhelming and suggests its newer products and services will not accelerate its top-line performance yet.
While Wall Street chases Nvidia at all-time highs, an under-the-radar semiconductor supplier is dominating a critical AI component these giants can’t build without. Click here to access our free report one of our favorites growth stories.
Operating Margin
Operating margin is an important measure of profitability as it shows the portion of revenue left after accounting for all core expenses – everything from the cost of goods sold to advertising and wages. It’s also useful for comparing profitability across companies with different levels of debt and tax rates because it excludes interest and taxes.
AMETEK has been a well-oiled machine over the last five years. It demonstrated elite profitability for an industrials business, boasting an average operating margin of 25.1%. This result isn’t too surprising as its gross margin gives it a favorable starting point.
Analyzing the trend in its profitability, AMETEK’s operating margin rose by 2.2 percentage points over the last five years, as its sales growth gave it operating leverage.
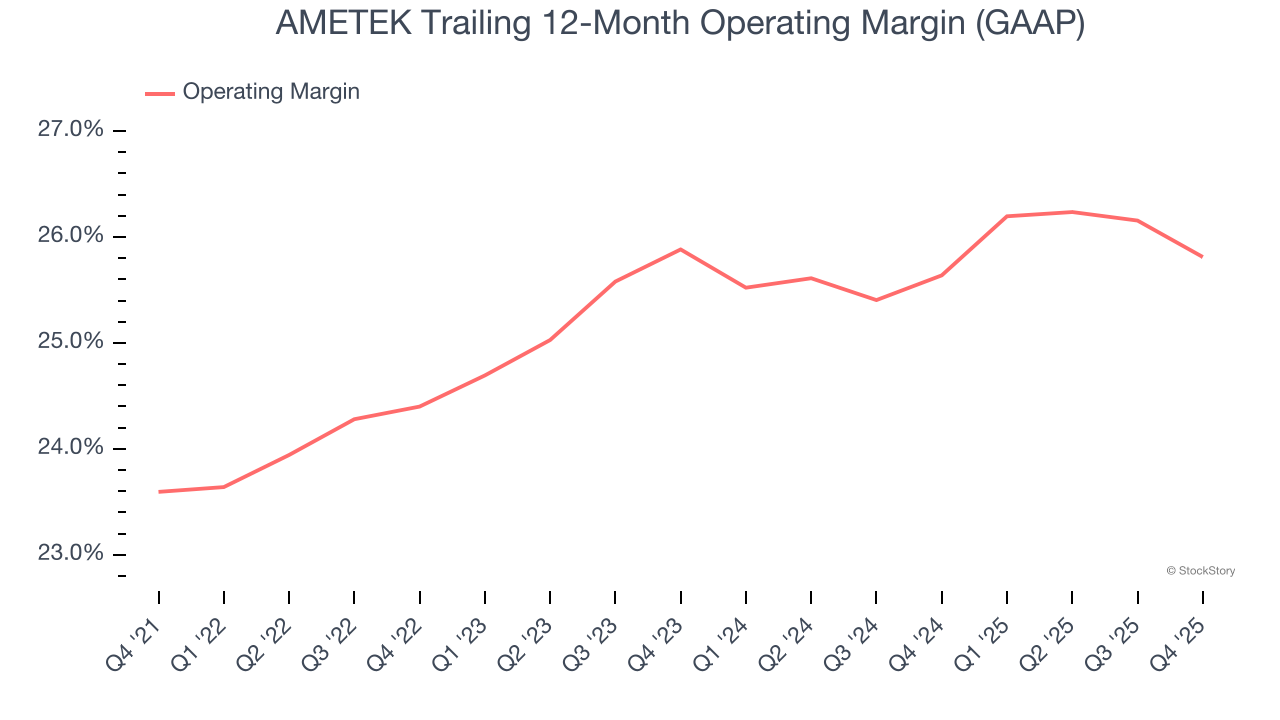
In Q4, AMETEK generated an operating margin profit margin of 25.3%, down 1.3 percentage points year on year. Since AMETEK’s operating margin decreased more than its gross margin, we can assume it was less efficient because expenses such as marketing, R&D, and administrative overhead increased.
Earnings Per Share
We track the long-term change in earnings per share (EPS) for the same reason as long-term revenue growth. Compared to revenue, however, EPS highlights whether a company’s growth is profitable.
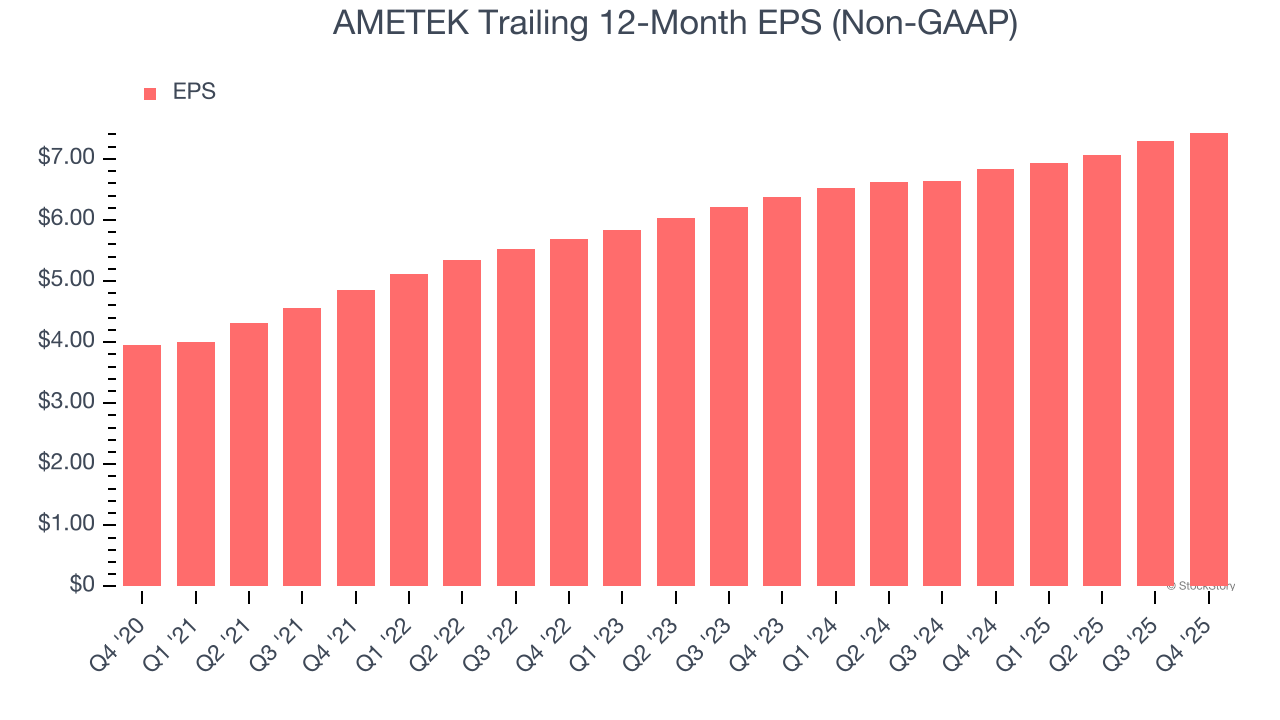
AMETEK’s EPS grew at a remarkable 13.5% compounded annual growth rate over the last five years, higher than its 10.3% annualized revenue growth. This tells us the company became more profitable on a per-share basis as it expanded.
Diving into the nuances of AMETEK’s earnings can give us a better understanding of its performance. As we mentioned earlier, AMETEK’s operating margin declined this quarter but expanded by 2.2 percentage points over the last five years. This was the most relevant factor (aside from the revenue impact) behind its higher earnings; interest expenses and taxes can also affect EPS but don’t tell us as much about a company’s fundamentals.
Like with revenue, we analyze EPS over a more recent period because it can provide insight into an emerging theme or development for the business.
For AMETEK, its two-year annual EPS growth of 7.9% was lower than its five-year trend. We hope its growth can accelerate in the future.
In Q4, AMETEK reported adjusted EPS of $2.01, up from $1.87 in the same quarter last year. This print beat analysts’ estimates by 3.4%. Over the next 12 months, Wall Street expects AMETEK’s full-year EPS of $7.43 to grow 7.8%.
Key Takeaways from AMETEK’s Q4 Results
We enjoyed seeing AMETEK beat analysts’ revenue expectations this quarter. We were also glad its EPS outperformed Wall Street’s estimates. On the other hand, its EPS guidance for next quarter slightly missed and its full-year EPS guidance was in line with Wall Street’s estimates. Overall, this print was mixed. The stock remained flat at $228.09 immediately following the results.
Is AMETEK an attractive investment opportunity at the current price? When making that decision, it’s important to consider its valuation, business qualities, as well as what has happened in the latest quarter. We cover that in our actionable full research report which you can read here (it’s free).