

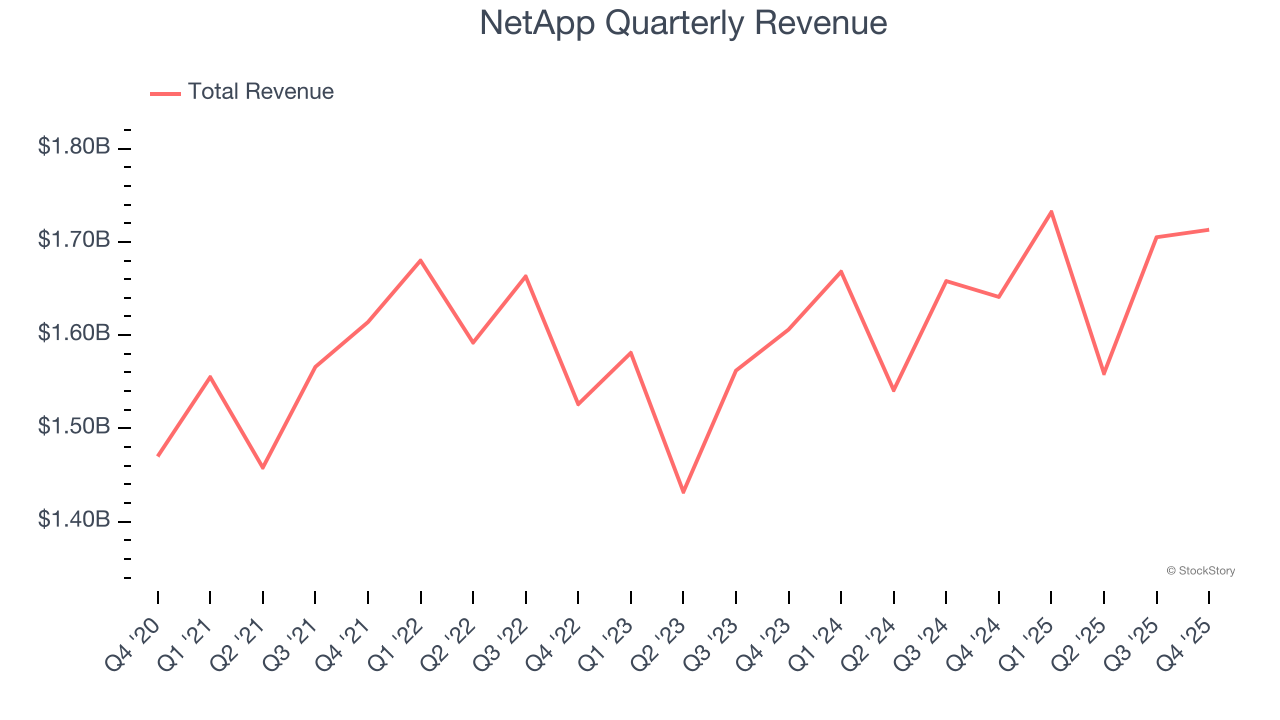
Data storage company NetApp (NASDAQ: NTAP) announced better-than-expected revenue in Q4 CY2025, with sales up 4.4% year on year to $1.71 billion. On top of that, next quarter’s revenue guidance ($1.87 billion at the midpoint) was surprisingly good and 4% above what analysts were expecting. Its non-GAAP profit of $2.12 per share was 2.8% above analysts’ consensus estimates.
Is now the time to buy NetApp? Find out by accessing our full research report, it’s free.
NetApp (NTAP) Q4 CY2025 Highlights:
- Revenue: $1.71 billion vs analyst estimates of $1.69 billion (4.4% year-on-year growth, 1.2% beat)
- Adjusted EPS: $2.12 vs analyst estimates of $2.06 (2.8% beat)
- Adjusted EBITDA: $579 million vs analyst estimates of $582.7 million (33.8% margin, 0.6% miss)
- Revenue Guidance for Q1 CY2026 is $1.87 billion at the midpoint, above analyst estimates of $1.8 billion
- Management slightly raised its full-year Adjusted EPS guidance to $7.97 at the midpoint
- Operating Margin: 25.3%, up from 22.1% in the same quarter last year
- Free Cash Flow Margin: 15.8%, down from 20.6% in the same quarter last year
- Market Capitalization: $20.18 billion
Company Overview
Founded in 1992 as a pioneer in networked storage technology, NetApp (NASDAQ: NTAP) provides data storage and management solutions that help organizations store, protect, and optimize their data across on-premises data centers and public clouds.
Revenue Growth
A company’s long-term sales performance can indicate its overall quality. Any business can have short-term success, but a top-tier one grows for years.
With $6.71 billion in revenue over the past 12 months, NetApp is one of the larger companies in the business services industry and benefits from a well-known brand that influences purchasing decisions. However, its scale is a double-edged sword because finding new avenues for growth becomes difficult when you already have a substantial market presence. For NetApp to boost its sales, it likely needs to adjust its prices, launch new offerings, or lean into foreign markets.
As you can see below, NetApp’s 3.7% annualized revenue growth over the last five years was tepid. This shows it failed to generate demand in any major way and is a rough (but perhaps misleading) starting point for our analysis.
We at StockStory place the most emphasis on long-term growth, but within business services, a half-decade historical view may miss recent innovations or disruptive industry trends. NetApp’s annualized revenue growth of 4.2% over the last two years aligns with its five-year trend, suggesting its demand was consistently weak. 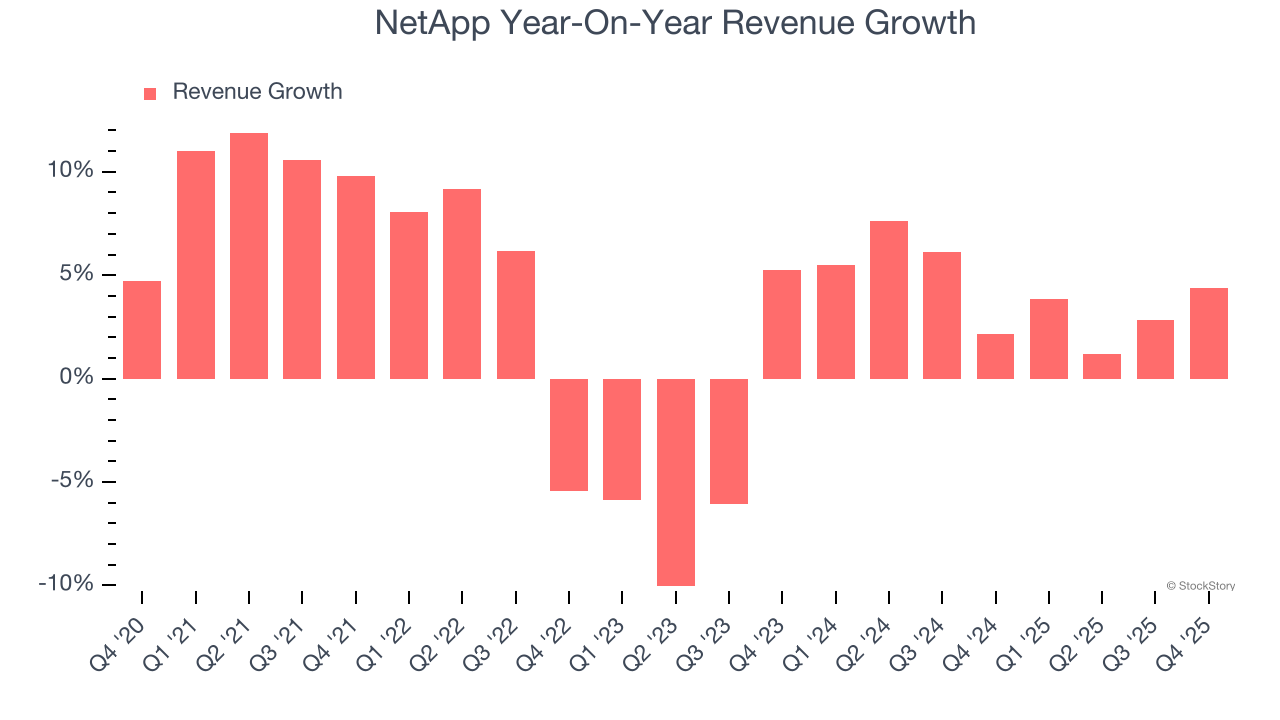
This quarter, NetApp reported modest year-on-year revenue growth of 4.4% but beat Wall Street’s estimates by 1.2%. Company management is currently guiding for a 8% year-on-year increase in sales next quarter.
Looking further ahead, sell-side analysts expect revenue to grow 4.5% over the next 12 months, similar to its two-year rate. This projection is underwhelming and implies its newer products and services will not accelerate its top-line performance yet. At least the company is tracking well in other measures of financial health.
Software is eating the world and there is virtually no industry left that has been untouched by it. That drives increasing demand for tools helping software developers do their jobs, whether it be monitoring critical cloud infrastructure, integrating audio and video functionality, or ensuring smooth content streaming. Click here to access a free report on our 3 favorite stocks to play this generational megatrend.
Operating Margin
NetApp’s operating margin has risen over the last 12 months and averaged 19.7% over the last five years. On top of that, its profitability was elite for a business services business thanks to its efficient cost structure and economies of scale.
Looking at the trend in its profitability, NetApp’s operating margin might fluctuated slightly but has generally stayed the same over the last five years. This raises questions about the company’s expense base because its revenue growth should have given it leverage on its fixed costs, resulting in better economies of scale and profitability.
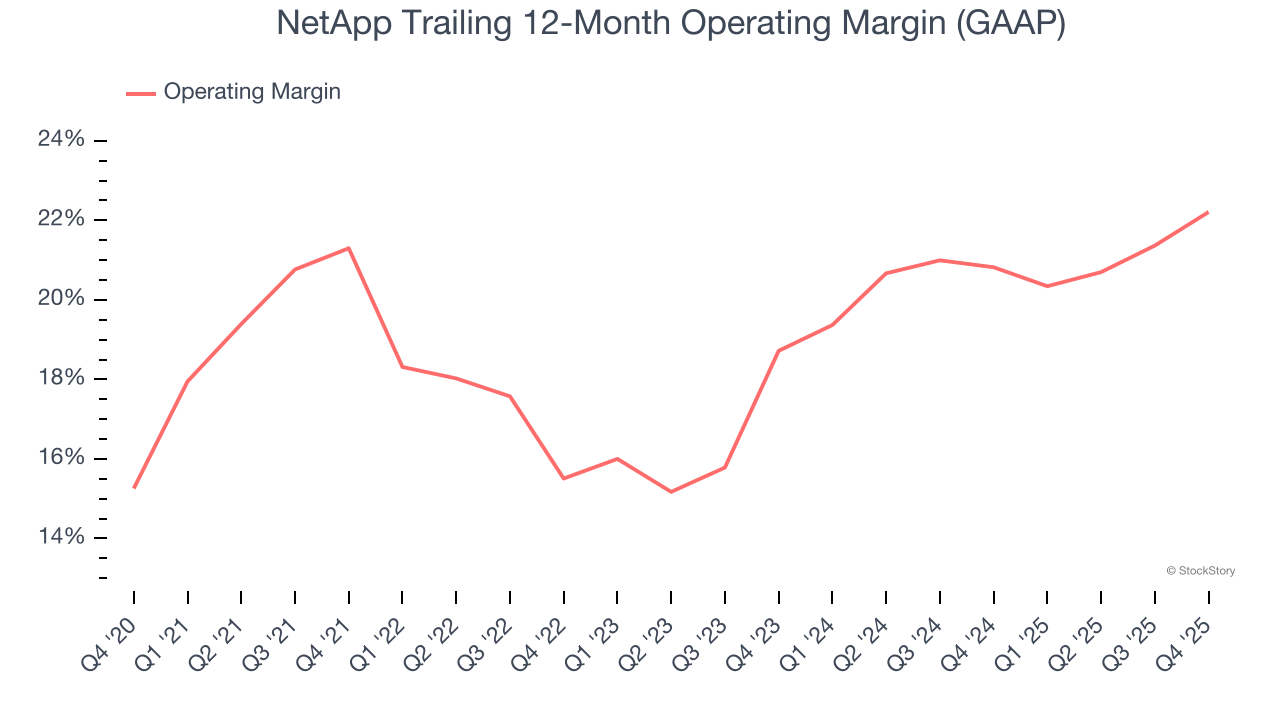
In Q4, NetApp generated an operating margin profit margin of 25.3%, up 3.3 percentage points year on year. This increase was a welcome development and shows it was more efficient.
Earnings Per Share
Revenue trends explain a company’s historical growth, but the long-term change in earnings per share (EPS) points to the profitability of that growth – for example, a company could inflate its sales through excessive spending on advertising and promotions.
NetApp’s EPS grew at a spectacular 13.5% compounded annual growth rate over the last five years, higher than its 3.7% annualized revenue growth. This tells us the company became more profitable on a per-share basis as it expanded.
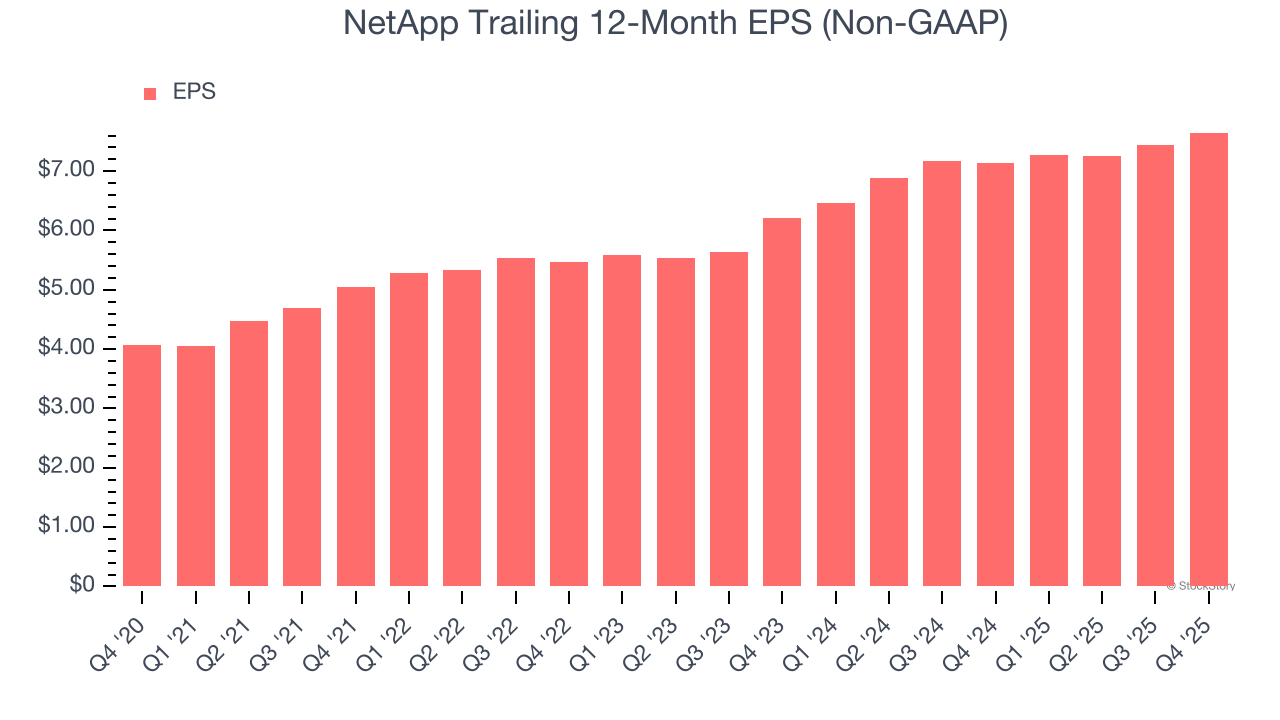
Like with revenue, we analyze EPS over a shorter period to see if we are missing a change in the business.
For NetApp, its two-year annual EPS growth of 11% was lower than its five-year trend. This wasn’t great, but at least the company was successful in other measures of financial health.
In Q4, NetApp reported adjusted EPS of $2.12, up from $1.91 in the same quarter last year. This print beat analysts’ estimates by 2.8%. Over the next 12 months, Wall Street expects NetApp’s full-year EPS of $7.65 to grow 9.6%.
Key Takeaways from NetApp’s Q4 Results
We were impressed by NetApp’s optimistic revenue guidance for next quarter, which blew past analysts’ expectations. We were also glad its full-year revenue guidance slightly exceeded Wall Street’s estimates. Overall, we think this was a solid quarter with some key areas of upside. The stock traded up 1.7% to $100.88 immediately following the results.
NetApp put up rock-solid earnings, but one quarter doesn’t necessarily make the stock a buy. Let’s see if this is a good investment. When making that decision, it’s important to consider its valuation, business qualities, as well as what has happened in the latest quarter. We cover that in our actionable full research report which you can read here (it’s free).


