

Infrastructure investment and operations firm FTAI Infrastructure (NASDAQ: FIP) fell short of the market’s revenue expectations in Q4 CY2025, but sales rose 77.7% year on year to $143.5 million. Its GAAP loss of $1.08 per share was significantly below analysts’ consensus estimates.
Is now the time to buy FTAI Infrastructure? Find out by accessing our full research report, it’s free.
FTAI Infrastructure (FIP) Q4 CY2025 Highlights:
- Revenue: $143.5 million vs analyst estimates of $169.2 million (77.7% year-on-year growth, 15.2% miss)
- EPS (GAAP): -$1.08 vs analyst estimates of -$0.43 (significant miss)
- Adjusted EBITDA: $89.16 million vs analyst estimates of $77.73 million (62.1% margin, 14.7% beat)
- Operating Margin: 889%, up from 24.4% in the same quarter last year
- Free Cash Flow was -$68.64 million compared to -$35.93 million in the same quarter last year
- Market Capitalization: $744.3 million
Company Overview
Spun off from FTAI Aviation in 2021, FTAI Infrastructure (NASDAQ: FIP) invests in and operates infrastructure and related assets across the transportation and energy sectors.
Revenue Growth
Examining a company’s long-term performance can provide clues about its quality. Any business can put up a good quarter or two, but the best consistently grow over the long haul. Over the last four years, FTAI Infrastructure grew its sales at an incredible 43% compounded annual growth rate. Its growth beat the average industrials company and shows its offerings resonate with customers, a helpful starting point for our analysis.
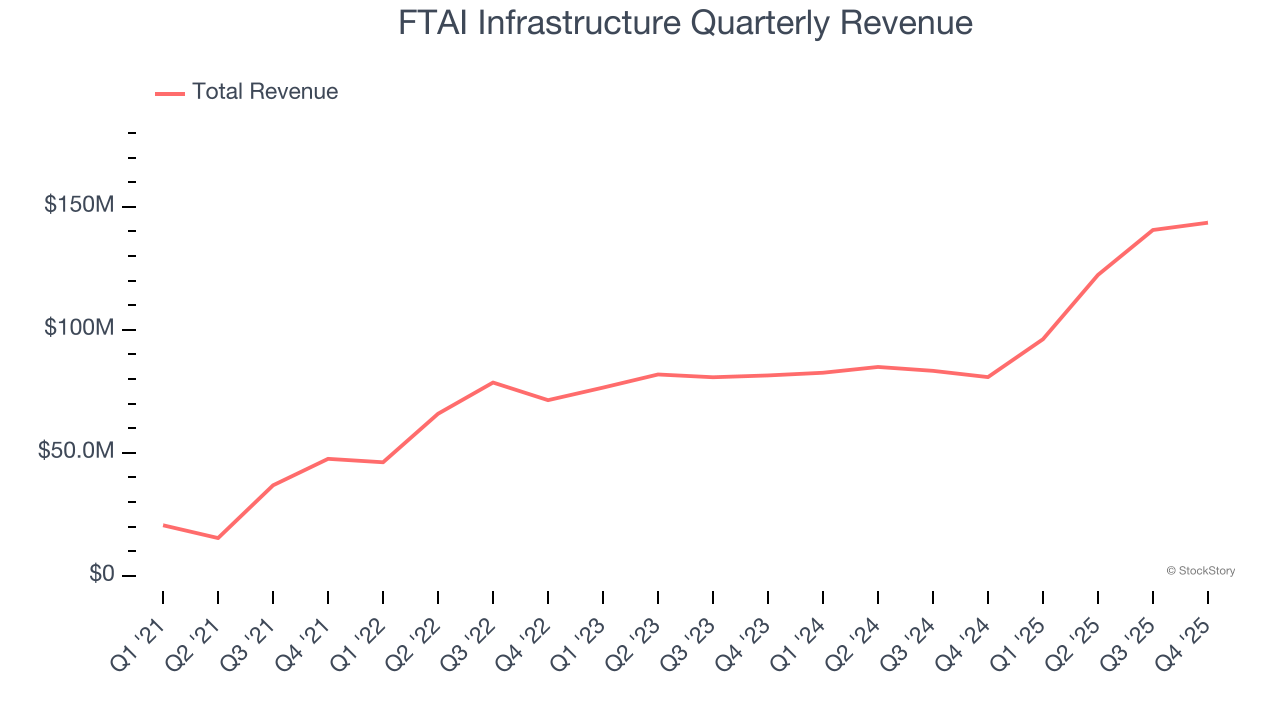
We at StockStory place the most emphasis on long-term growth, but within industrials, a stretched historical view may miss cycles, industry trends, or a company capitalizing on catalysts such as a new contract win or a successful product line. FTAI Infrastructure’s annualized revenue growth of 25.2% over the last two years is below its four-year trend, but we still think the results suggest healthy demand. 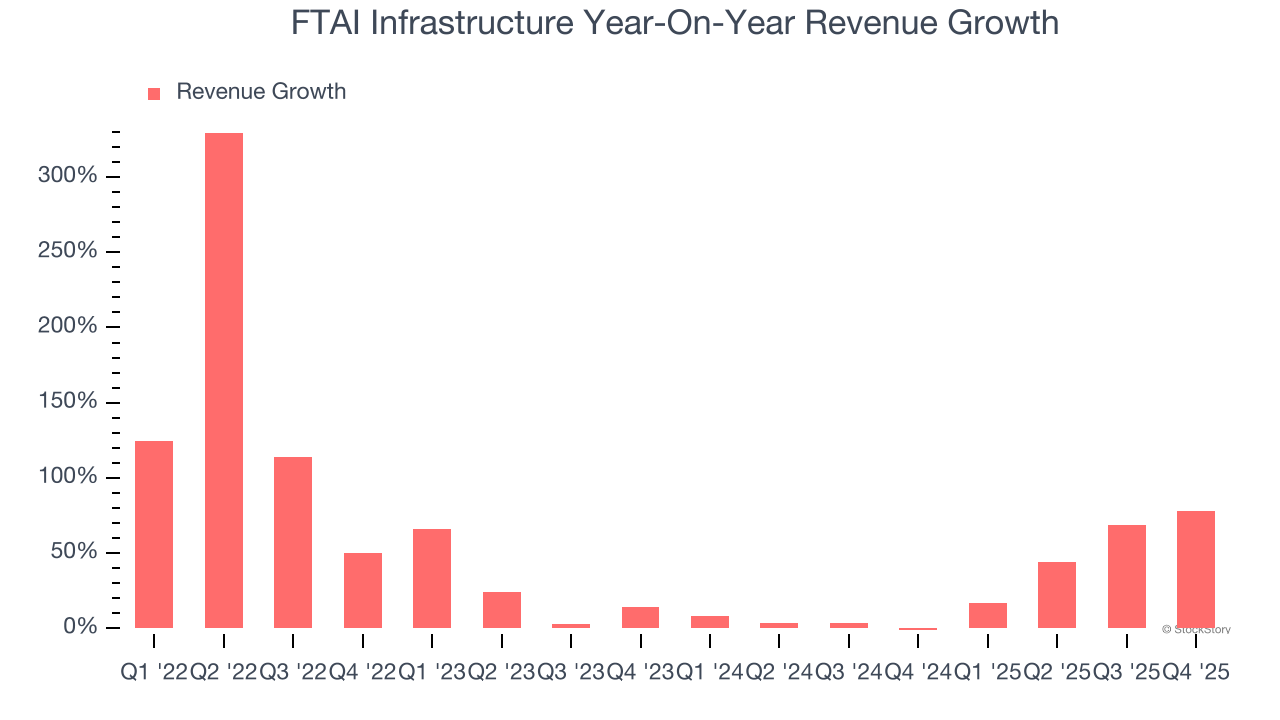
This quarter, FTAI Infrastructure achieved a magnificent 77.7% year-on-year revenue growth rate, but its $143.5 million of revenue fell short of Wall Street’s lofty estimates.
Looking ahead, sell-side analysts expect revenue to grow 65.7% over the next 12 months, an improvement versus the last two years. This projection is eye-popping and implies its newer products and services will spur better top-line performance.
The 1999 book Gorilla Game predicted Microsoft and Apple would dominate tech before it happened. Its thesis? Identify the platform winners early. Today, enterprise software companies embedding generative AI are becoming the new gorillas. a profitable, fast-growing enterprise software stock that is already riding the automation wave and looking to catch the generative AI next.
Operating Margin
Operating margin is a key measure of profitability. Think of it as net income - the bottom line - excluding the impact of taxes and interest on debt, which are less connected to business fundamentals.
FTAI Infrastructure has been a well-oiled machine over the last five years. It demonstrated elite profitability for an industrials business, boasting an average operating margin of 75.6%. This result isn’t too surprising as its gross margin gives it a favorable starting point.
Looking at the trend in its profitability, FTAI Infrastructure’s operating margin rose significantly over the last five years, as its sales growth gave it immense operating leverage.
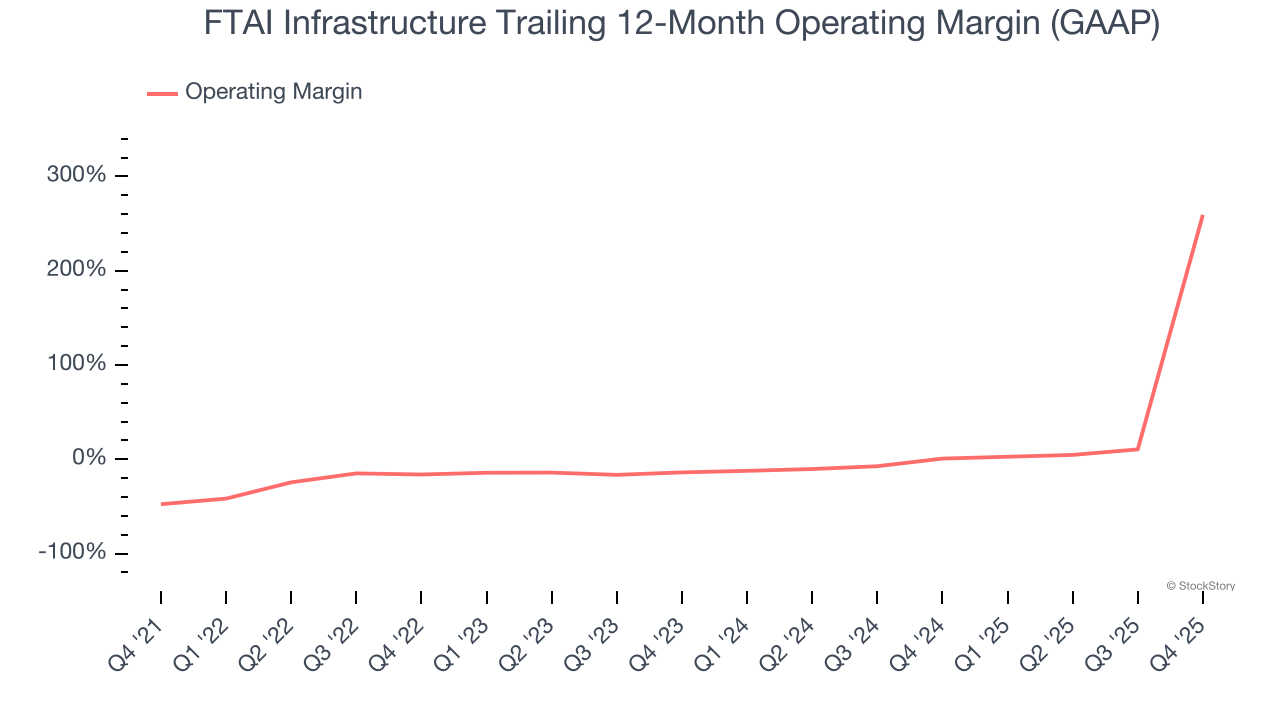
In Q4, FTAI Infrastructure generated an operating margin profit margin of 889%, up 864.7 percentage points year on year. The increase was solid, and because its operating margin rose more than its gross margin, we can infer it was more efficient with expenses such as marketing, R&D, and administrative overhead.
Cash Is King
Although earnings are undoubtedly valuable for assessing company performance, we believe cash is king because you can’t use accounting profits to pay the bills.
FTAI Infrastructure’s demanding reinvestments have drained its resources over the last five years, putting it in a pinch and limiting its ability to return capital to investors. Its free cash flow margin averaged negative 68.7%, meaning it lit $68.68 of cash on fire for every $100 in revenue. This is a stark contrast from its operating margin, and its investments in working capital/capital expenditures are the primary culprit.
Taking a step back, an encouraging sign is that FTAI Infrastructure’s margin expanded by 89 percentage points during that time. In light of its glaring cash burn, however, this improvement is a bucket of hot water in a cold ocean.
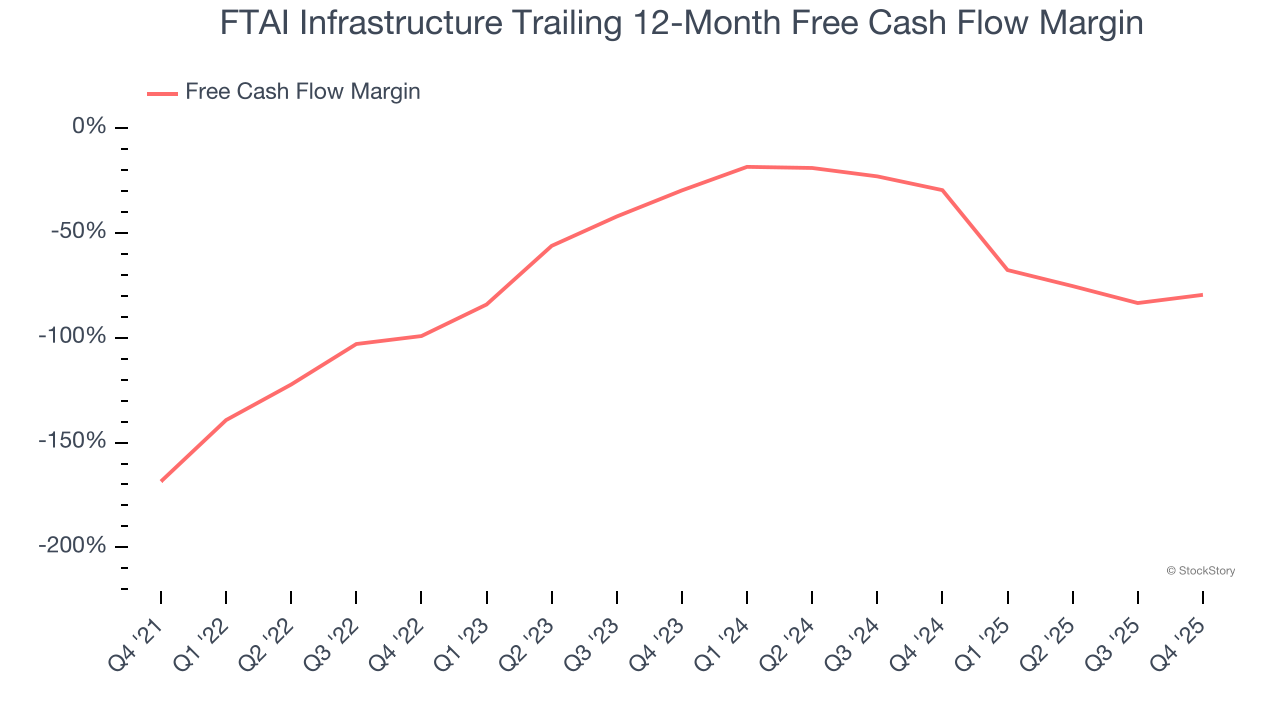
FTAI Infrastructure burned through $68.64 million of cash in Q4, equivalent to a negative 47.8% margin. The company’s cash burn increased from $35.93 million of lost cash in the same quarter last year.
Key Takeaways from FTAI Infrastructure’s Q4 Results
We were impressed by how significantly FTAI Infrastructure blew past analysts’ EBITDA expectations this quarter. On the other hand, its revenue missed and its EPS fell short of Wall Street’s estimates. Overall, this was a softer quarter. The stock traded down 1.6% to $6.34 immediately after reporting.
FTAI Infrastructure may have had a tough quarter, but does that actually create an opportunity to invest right now? When making that decision, it’s important to consider its valuation, business qualities, as well as what has happened in the latest quarter. We cover that in our actionable full research report which you can read here (it’s free).


