

Real estate technology company Compass (NYSE: COMP) announced better-than-expected revenue in Q4 CY2025, with sales up 23.1% year on year to $1.7 billion. The company expects next quarter’s revenue to be around $2.65 billion, close to analysts’ estimates. Its GAAP loss of $0.07 per share was 18.1% below analysts’ consensus estimates.
Is now the time to buy Compass? Find out by accessing our full research report, it’s free.
Compass (COMP) Q4 CY2025 Highlights:
- Revenue: $1.7 billion vs analyst estimates of $1.67 billion (23.1% year-on-year growth, 1.8% beat)
- EPS (GAAP): -$0.07 vs analyst expectations of -$0.06 (18.1% miss)
- Adjusted EBITDA: $58.3 million vs analyst estimates of $49.71 million (3.4% margin, 17.3% beat)
- Revenue Guidance for Q1 CY2026 is $2.65 billion at the midpoint, roughly in line with what analysts were expecting
- EBITDA guidance for Q1 CY2026 is $25 million at the midpoint, below analyst estimates of $43.08 million
- Operating Margin: -2.5%, in line with the same quarter last year
- Free Cash Flow Margin: 2.5%, similar to the same quarter last year
- Transactions: 60,328, up 9,917 year on year
- Market Capitalization: $5.36 billion
"Compass ended 2025 on a high note as we delivered the strongest Q4 results in our history, including Revenue, Adjusted EBITDA1, Adjusted EBITDA Margin, Organic Gross Principal Agent Adds, T&E revenue, mortgage JV profitability, and weekly agent sessions on the platform," said Robert Reffkin, Founder and Chief Executive Officer of Compass.
Company Overview
Fueled by its mission to replace the "paper-driven, antiquated workflow" of buying a house, Compass (NYSE: COMP) is a digital-first company operating a residential real estate brokerage in the United States.
Revenue Growth
A company’s long-term sales performance can indicate its overall quality. Any business can put up a good quarter or two, but many enduring ones grow for years. Over the last five years, Compass grew its sales at a 13.3% annual rate. Though this growth is acceptable on an absolute basis, we need to see more than just topline growth for the consumer discretionary sector, which can display significant earnings volatility. This means our bar for the sector is particularly high, reflecting the non-essential and hit-driven nature of the products and services offered. Additionally, five-year CAGR starts around Covid, when revenue was depressed then rebounded.
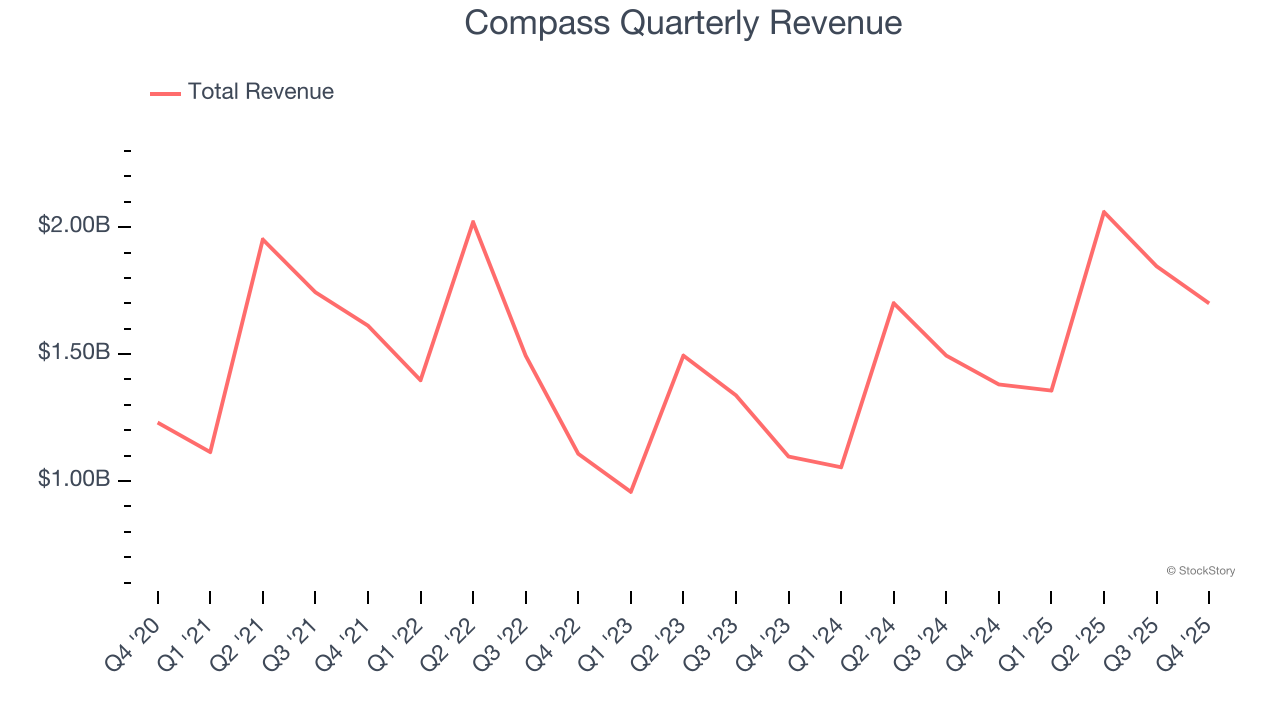
Long-term growth is the most important, but within consumer discretionary, product cycles are short and revenue can be hit-driven due to rapidly changing trends and consumer preferences. Compass’s annualized revenue growth of 19.4% over the last two years is above its five-year trend, which is encouraging. 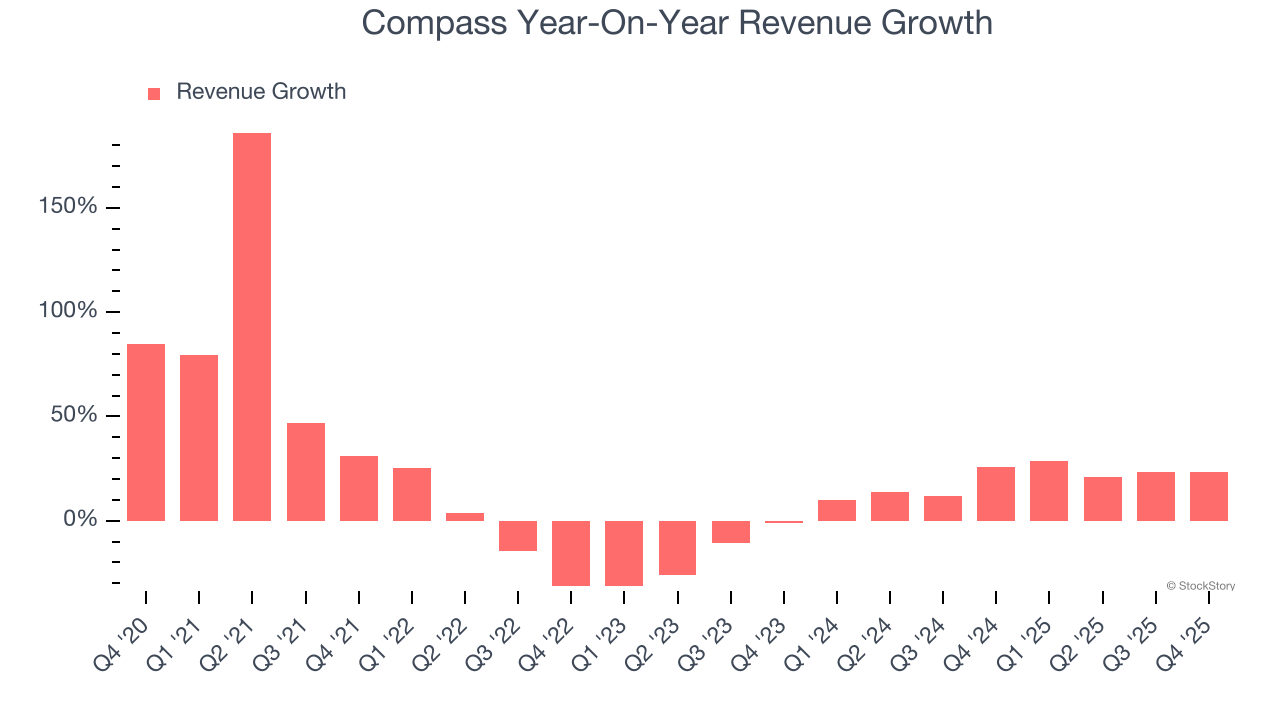
We can better understand the company’s revenue dynamics by analyzing its number of transactions, which reached 60,328 in the latest quarter. Over the last two years, Compass’s transactions averaged 21.7% year-on-year growth. Because this number is higher than its revenue growth during the same period, we can see the company’s monetization has fallen. 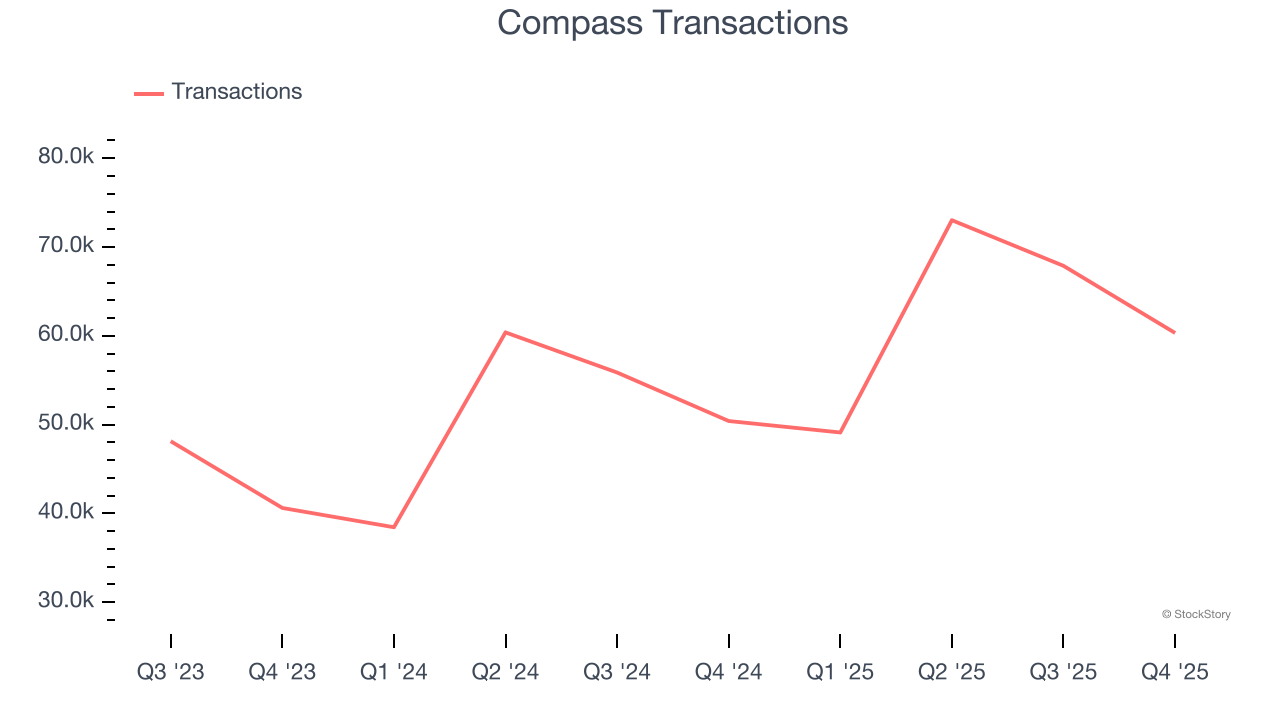
This quarter, Compass reported robust year-on-year revenue growth of 23.1%, and its $1.7 billion of revenue topped Wall Street estimates by 1.8%. Company management is currently guiding for a 95.4% year-on-year increase in sales next quarter.
Looking further ahead, sell-side analysts expect revenue to grow 100% over the next 12 months, an improvement versus the last two years. This projection is eye-popping and implies its newer products and services will spur better top-line performance.
While Wall Street chases Nvidia at all-time highs, an under-the-radar semiconductor supplier is dominating a critical AI component these giants can’t build without. Click here to access our free report one of our favorites growth stories.
Operating Margin
Operating margin is an important measure of profitability as it shows the portion of revenue left after accounting for all core expenses – everything from the cost of goods sold to advertising and wages. It’s also useful for comparing profitability across companies with different levels of debt and tax rates because it excludes interest and taxes.
Compass’s operating margin has risen over the last 12 months, but it still averaged negative 1.7% over the last two years. This is due to its large expense base and inefficient cost structure.
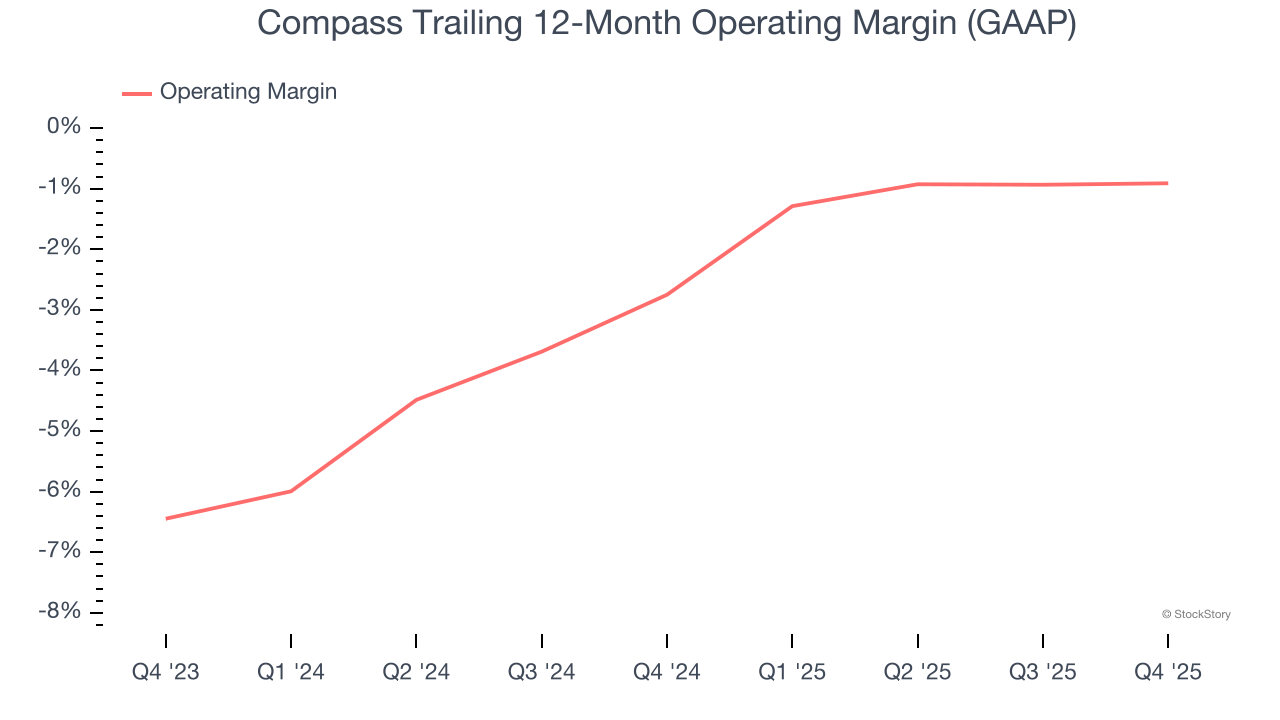
Compass’s operating margin was negative 2.5% this quarter. The company's consistent lack of profits raise a flag.
Earnings Per Share
Revenue trends explain a company’s historical growth, but the long-term change in earnings per share (EPS) points to the profitability of that growth – for example, a company could inflate its sales through excessive spending on advertising and promotions.
Although Compass’s full-year earnings are still negative, it reduced its losses and improved its EPS by 47.3% annually over the last five years. The next few quarters will be critical for assessing its long-term profitability.
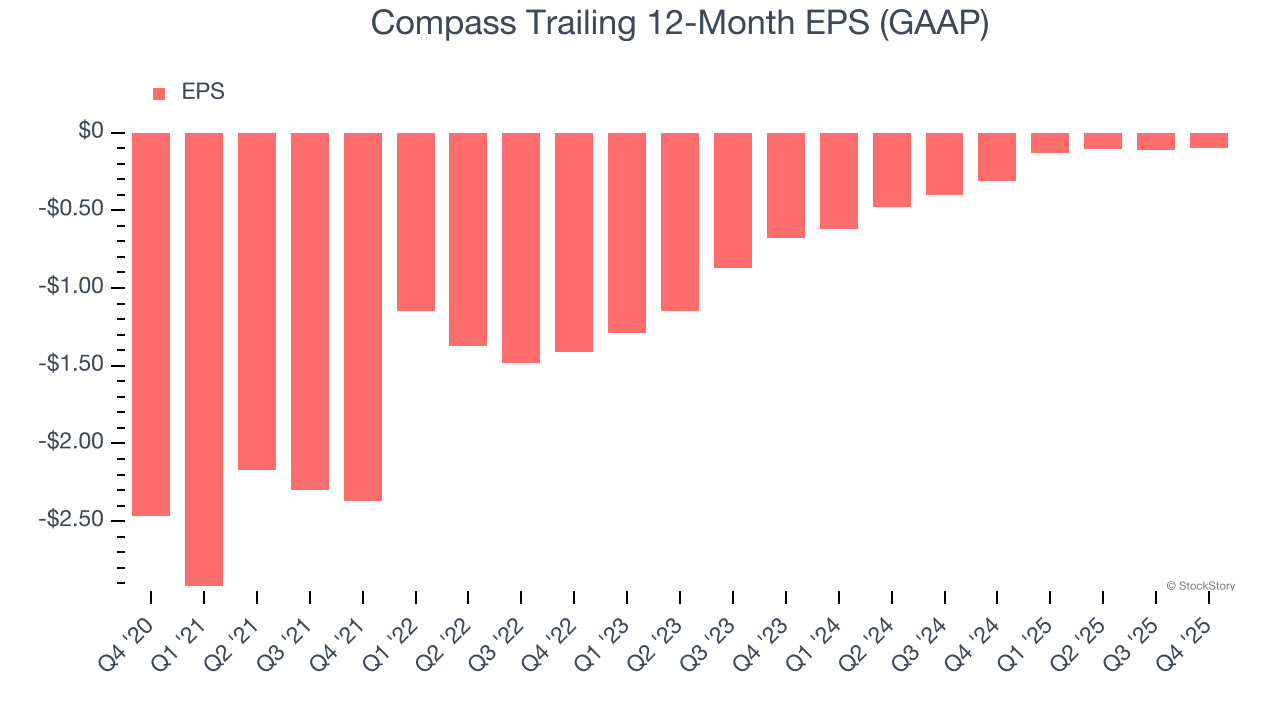
In Q4, Compass reported EPS of negative $0.07, up from negative $0.08 in the same quarter last year. Despite growing year on year, this print missed analysts’ estimates. Over the next 12 months, Wall Street is optimistic. Analysts forecast Compass’s full-year EPS of negative $0.10 will flip to positive $0.32.
Key Takeaways from Compass’s Q4 Results
We enjoyed seeing Compass beat analysts’ EBITDA expectations this quarter. We were also happy its revenue outperformed Wall Street’s estimates. On the other hand, its EPS missed and its EBITDA guidance for next quarter fell short of Wall Street’s estimates. Overall, this was a softer quarter. The stock traded down 2.9% to $9.71 immediately after reporting.
Compass’s earnings report left more to be desired. Let’s look forward to see if this quarter has created an opportunity to buy the stock. If you’re making that decision, you should consider the bigger picture of valuation, business qualities, as well as the latest earnings. We cover that in our actionable full research report which you can read here (it’s free).


