Workplace uniform provider UniFirst (NYSE: UNF) fell short of the market’s revenue expectations in Q2 CY2025 as sales only rose 1.2% year on year to $610.8 million. On the other hand, the company’s outlook for the full year was close to analysts’ estimates with revenue guided to $2.43 billion at the midpoint. Its GAAP profit of $2.13 per share was 7% above analysts’ consensus estimates.
Is now the time to buy UniFirst? Find out by accessing our full research report, it’s free.
UniFirst (UNF) Q2 CY2025 Highlights:
- Revenue: $610.8 million vs analyst estimates of $614.7 million (1.2% year-on-year growth, 0.6% miss)
- EPS (GAAP): $2.13 vs analyst estimates of $1.99 (7% beat)
- Adjusted EBITDA: $85.83 million vs analyst estimates of $91.77 million (14.1% margin, 6.5% miss)
- The company reconfirmed its revenue guidance for the full year of $2.43 billion at the midpoint
- EPS (GAAP) guidance for the full year is $7.80 at the midpoint, beating analyst estimates by 3.1%
- Operating Margin: 7.9%, in line with the same quarter last year
- Free Cash Flow Margin: 4%, down from 6.2% in the same quarter last year
- Market Capitalization: $3.53 billion
Company Overview
With a fleet of trucks making weekly deliveries to over 300,000 customer locations, UniFirst (NYSE: UNF) provides, rents, cleans, and maintains workplace uniforms and protective clothing for businesses across various industries.
Revenue Growth
Reviewing a company’s long-term sales performance reveals insights into its quality. Any business can put up a good quarter or two, but many enduring ones grow for years.
With $2.46 billion in revenue over the past 12 months, UniFirst is a mid-sized business services company, which sometimes brings disadvantages compared to larger competitors benefiting from better economies of scale. On the bright side, it can still flex high growth rates because it’s working from a smaller revenue base.
As you can see below, UniFirst’s 5.8% annualized revenue growth over the last five years was decent. This shows its offerings generated slightly more demand than the average business services company, a useful starting point for our analysis.
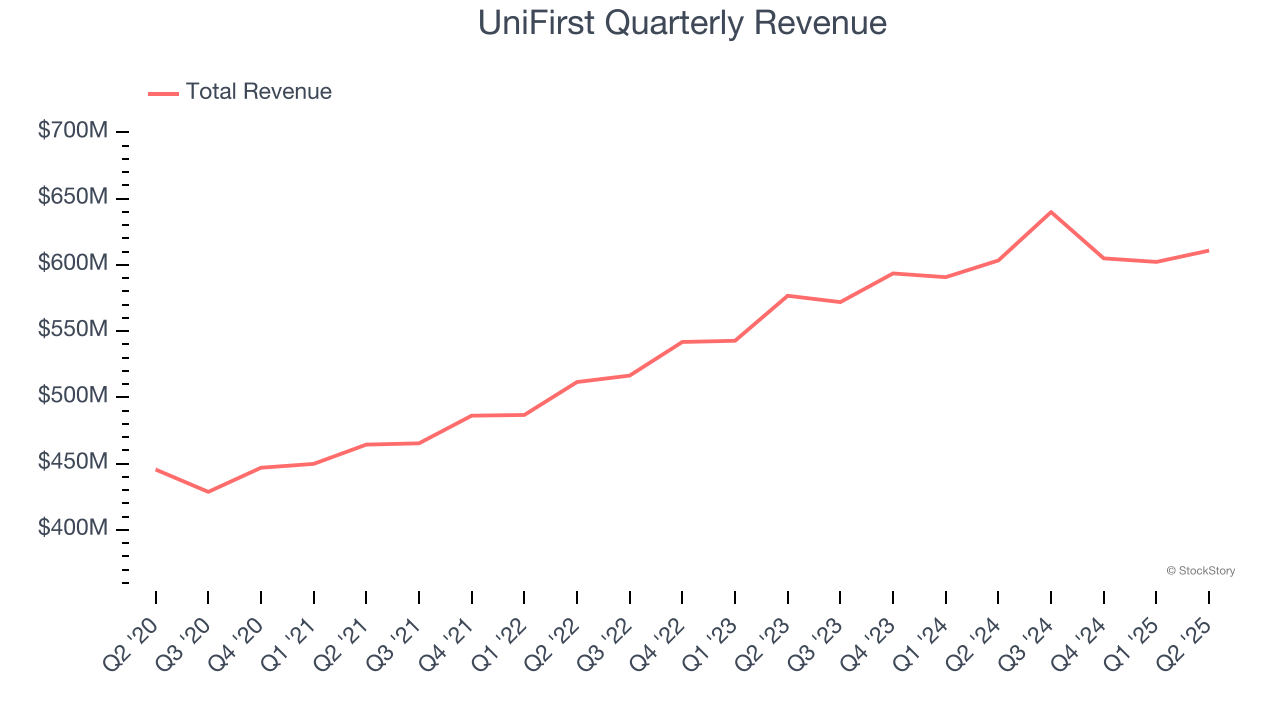
Long-term growth is the most important, but within business services, a half-decade historical view may miss new innovations or demand cycles. UniFirst’s annualized revenue growth of 6.2% over the last two years aligns with its five-year trend, suggesting its demand was stable. 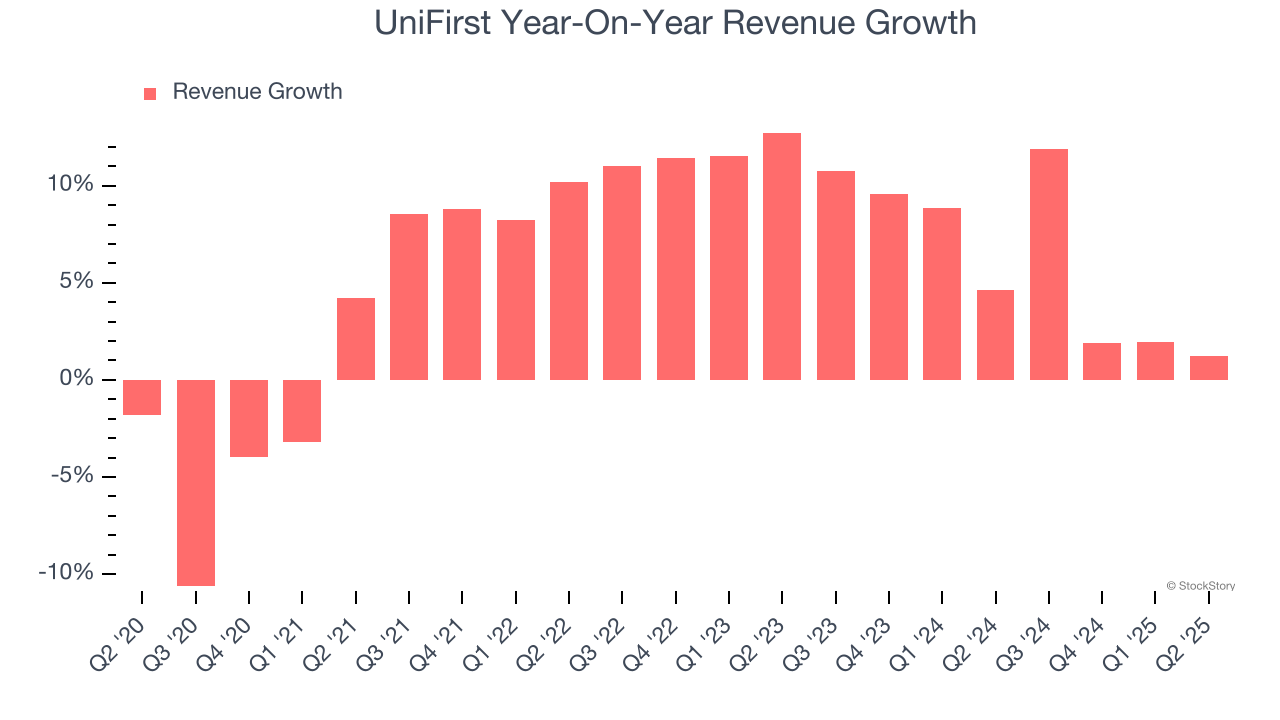
We can dig further into the company’s revenue dynamics by analyzing its most important segment, Core Laundry Operations. Over the last two years, UniFirst’s Core Laundry Operations revenue (uniform rental and laundering) averaged 6.3% year-on-year growth.
This quarter, UniFirst’s revenue grew by 1.2% year on year to $610.8 million, falling short of Wall Street’s estimates.
Looking ahead, sell-side analysts expect revenue to grow 1.3% over the next 12 months, a deceleration versus the last two years. This projection is underwhelming and implies its products and services will see some demand headwinds.
Software is eating the world and there is virtually no industry left that has been untouched by it. That drives increasing demand for tools helping software developers do their jobs, whether it be monitoring critical cloud infrastructure, integrating audio and video functionality, or ensuring smooth content streaming. Click here to access a free report on our 3 favorite stocks to play this generational megatrend.
Operating Margin
UniFirst was profitable over the last five years but held back by its large cost base. Its average operating margin of 7.5% was weak for a business services business.
Looking at the trend in its profitability, UniFirst’s operating margin decreased by 2.4 percentage points over the last five years. This raises questions about the company’s expense base because its revenue growth should have given it leverage on its fixed costs, resulting in better economies of scale and profitability. UniFirst’s performance was poor no matter how you look at it - it shows that costs were rising and it couldn’t pass them onto its customers.

In Q2, UniFirst generated an operating margin profit margin of 7.9%, in line with the same quarter last year. This indicates the company’s overall cost structure has been relatively stable.
Earnings Per Share
Revenue trends explain a company’s historical growth, but the long-term change in earnings per share (EPS) points to the profitability of that growth – for example, a company could inflate its sales through excessive spending on advertising and promotions.
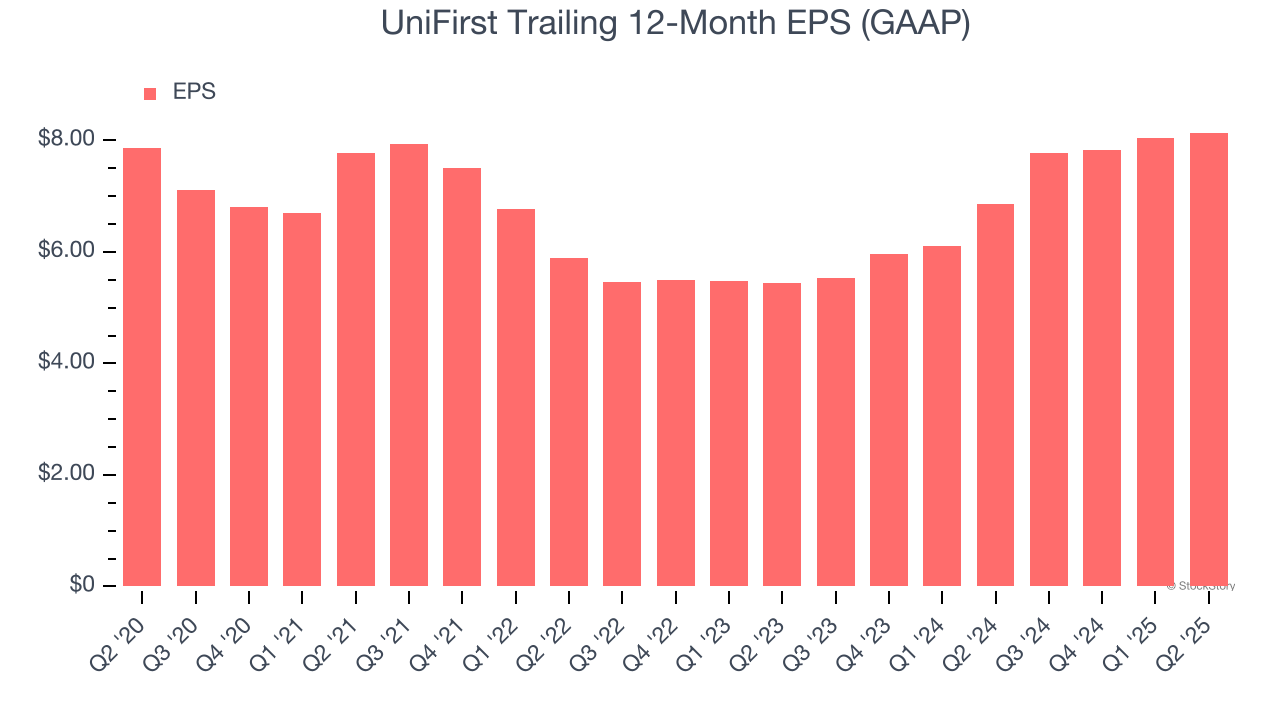
UniFirst’s flat EPS over the last five years was below its 5.8% annualized revenue growth. This tells us the company became less profitable on a per-share basis as it expanded due to non-fundamental factors such as interest expenses and taxes.
Diving into the nuances of UniFirst’s earnings can give us a better understanding of its performance. As we mentioned earlier, UniFirst’s operating margin was flat this quarter but declined by 2.4 percentage points over the last five years. This was the most relevant factor (aside from the revenue impact) behind its lower earnings; interest expenses and taxes can also affect EPS but don’t tell us as much about a company’s fundamentals.
In Q2, UniFirst reported EPS at $2.13, up from $2.03 in the same quarter last year. This print beat analysts’ estimates by 7%. Over the next 12 months, Wall Street expects UniFirst’s full-year EPS of $8.14 to grow 2.2%.
Key Takeaways from UniFirst’s Q2 Results
We enjoyed seeing UniFirst beat analysts’ full-year EPS guidance expectations this quarter. We were also happy its EPS outperformed Wall Street’s estimates. On the other hand, its revenue slightly missed. Overall, this print was mixed. The stock traded up 1.2% to $192.50 immediately following the results.
UniFirst had an encouraging quarter, but one earnings result doesn’t necessarily make the stock a buy. Let’s see if this is a good investment. We think that the latest quarter is only one piece of the longer-term business quality puzzle. Quality, when combined with valuation, can help determine if the stock is a buy. We cover that in our actionable full research report which you can read here, it’s free.