Since October 2024, Interface has been in a holding pattern, posting a small loss of 3.3% while floating around $17.94. However, the stock is beating the S&P 500’s 11% decline during that period.
Is there a buying opportunity in Interface, or does it present a risk to your portfolio? Get the full breakdown from our expert analysts, it’s free.
Even with the strong relative performance, we're cautious about Interface. Here are three reasons why we avoid TILE and a stock we'd rather own.
Why Do We Think Interface Will Underperform?
Pioneering carbon-neutral flooring since its founding in 1973, Interface (NASDAQ: TILE) is a global manufacturer of modular carpet tiles, luxury vinyl tile (LVT), and rubber flooring that specializes in carbon-neutral and sustainable flooring solutions.
1. Long-Term Revenue Growth Flatter Than a Pancake
A company’s long-term sales performance is one signal of its overall quality. Even a bad business can shine for one or two quarters, but a top-tier one grows for years. Unfortunately, Interface struggled to consistently increase demand as its $1.32 billion of sales for the trailing 12 months was close to its revenue five years ago. This wasn’t a great result and signals it’s a low quality business. 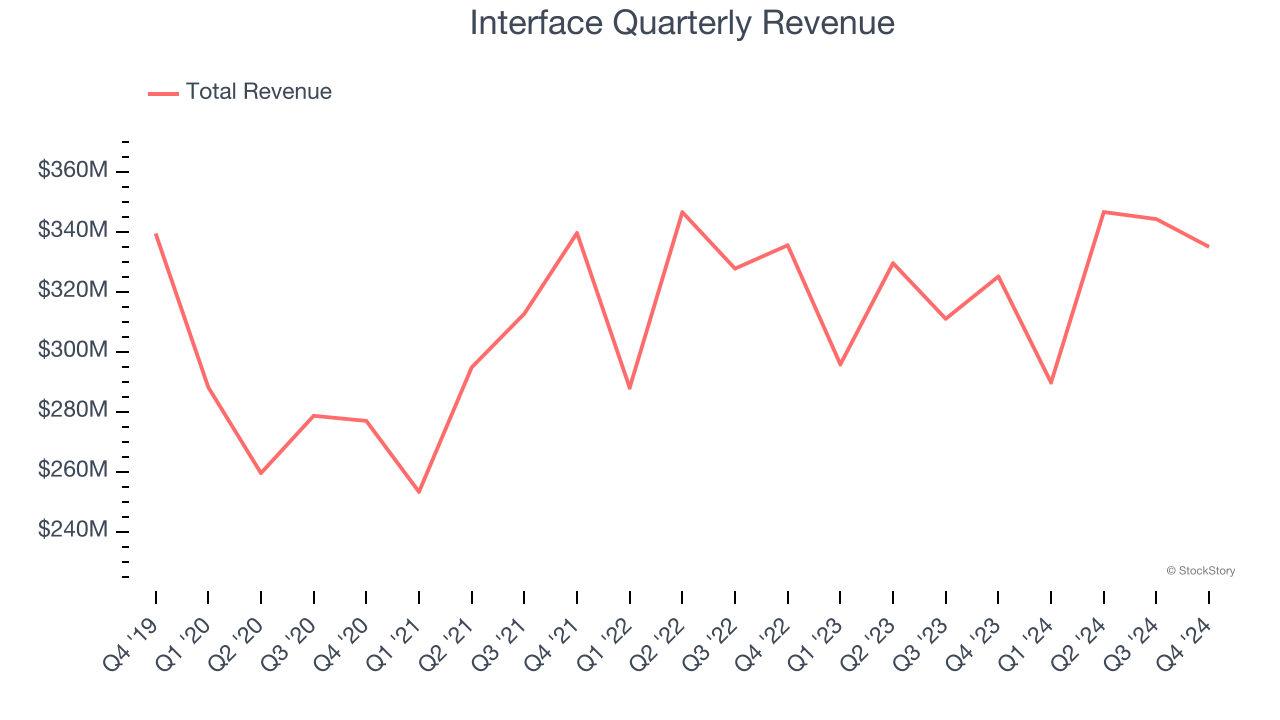
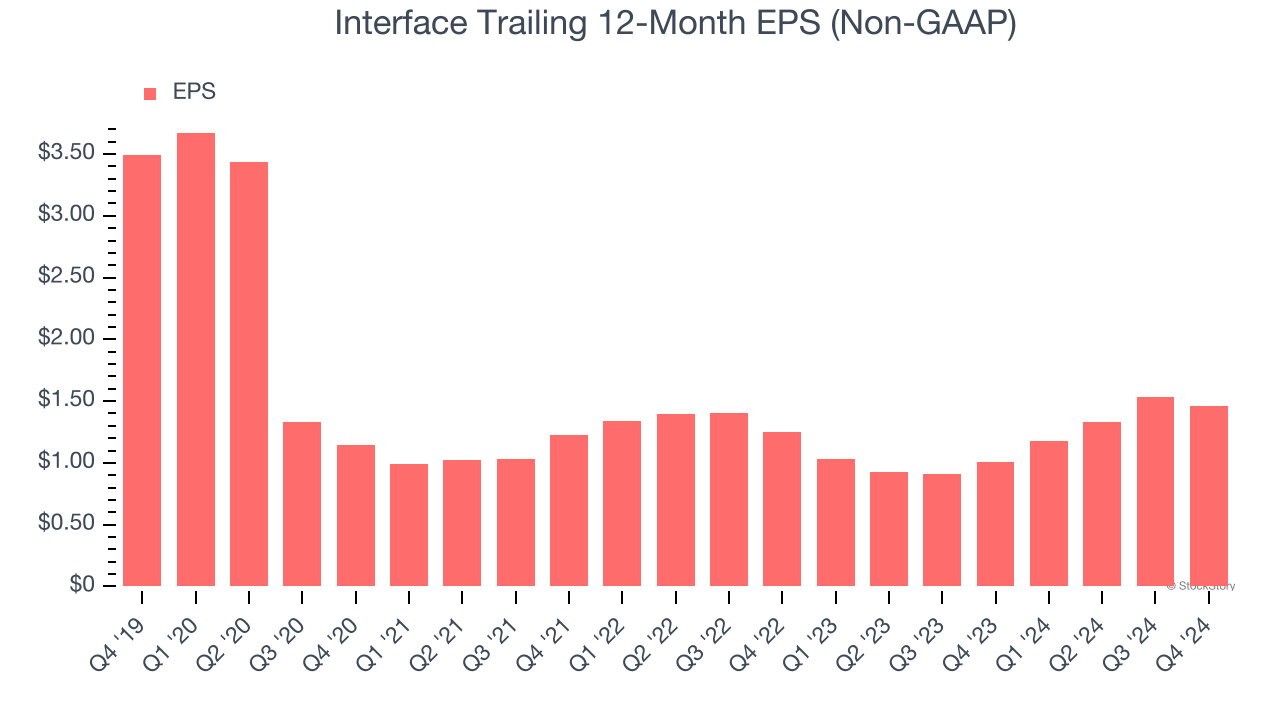
2. EPS Trending Down
Analyzing the long-term change in earnings per share (EPS) shows whether a company's incremental sales were profitable – for example, revenue could be inflated through excessive spending on advertising and promotions.
Sadly for Interface, its EPS declined by 16% annually over the last five years while its revenue was flat. This tells us the company struggled because its fixed cost base made it difficult to adjust to choppy demand.
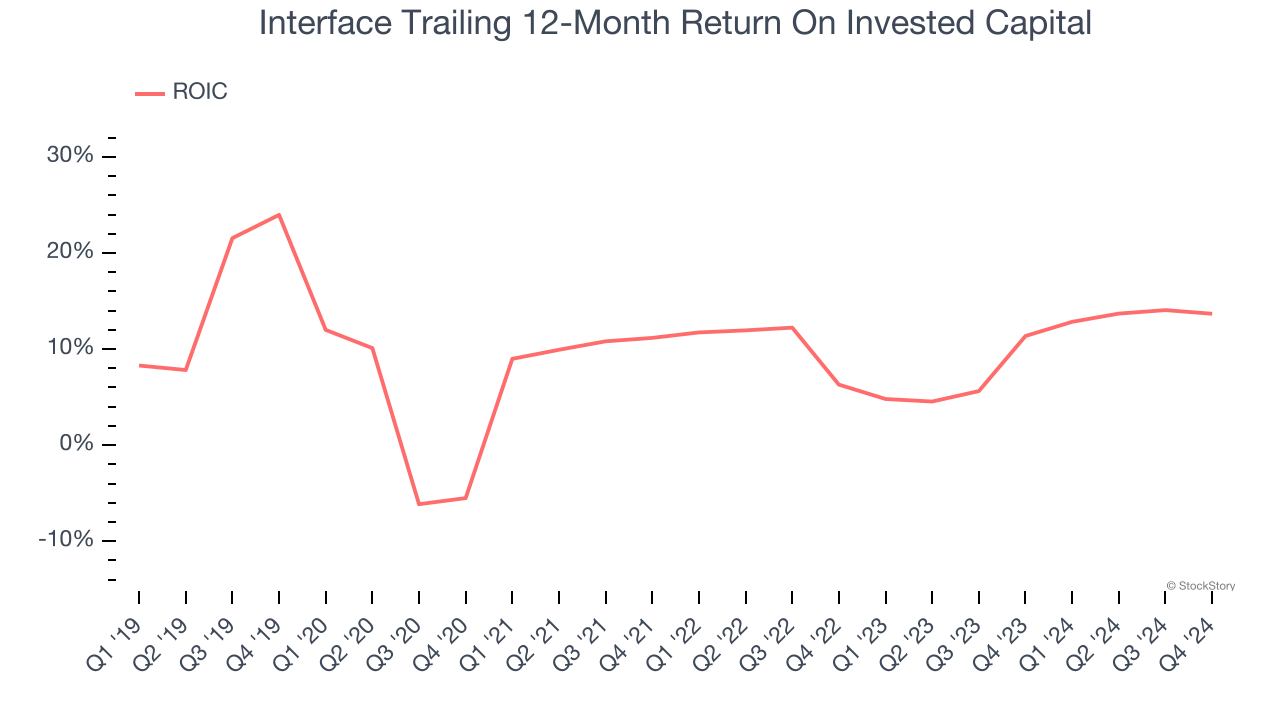
3. Previous Growth Initiatives Haven’t Impressed
Growth gives us insight into a company’s long-term potential, but how capital-efficient was that growth? A company’s ROIC explains this by showing how much operating profit it makes compared to the money it has raised (debt and equity).
Interface historically did a mediocre job investing in profitable growth initiatives. Its five-year average ROIC was 7.4%, somewhat low compared to the best business services companies that consistently pump out 25%+.
Final Judgment
Interface doesn’t pass our quality test. Following its recent outperformance in a weaker market environment, the stock trades at 12× forward price-to-earnings (or $17.94 per share). At this valuation, there’s a lot of good news priced in - we think there are better opportunities elsewhere. We’d recommend looking at one of Charlie Munger’s all-time favorite businesses.
Stocks We Would Buy Instead of Interface
The market surged in 2024 and reached record highs after Donald Trump’s presidential victory in November, but questions about new economic policies are adding much uncertainty for 2025.
While the crowd speculates what might happen next, we’re homing in on the companies that can succeed regardless of the political or macroeconomic environment. Put yourself in the driver’s seat and build a durable portfolio by checking out our Top 9 Market-Beating Stocks. This is a curated list of our High Quality stocks that have generated a market-beating return of 175% over the last five years.
Stocks that made our list in 2019 include now familiar names such as Nvidia (+2,183% between December 2019 and December 2024) as well as under-the-radar businesses like Comfort Systems (+751% five-year return). Find your next big winner with StockStory today for free.