

Chart currently trades at $127 per share and has shown little upside over the past six months, posting a middling return of 1%. However, the stock is beating the S&P 500’s 10.7% decline during that period.
Given the relative strength, is there still a buying opportunity in GTLS? Or is the market overestimating its value? Find out in our full research report, it’s free.
Why Is GTLS a Good Business?
Installing the first bulk Co2 tank for McDonalds’s sodas, Chart (NYSE: GTLS) provides equipment to store and transport gasses.
1. Surging Backlog Locks In Future Sales
Investors interested in Gas and Liquid Handling companies should track backlog in addition to reported revenue. This metric shows the value of outstanding orders that have not yet been executed or delivered, giving visibility into Chart’s future revenue streams.
Chart’s backlog punched in at $4.85 billion in the latest quarter, and over the last two years, its year-on-year growth averaged 60.1%. This performance was fantastic and shows the company has a robust sales pipeline because it is accumulating more orders than it can fulfill. Its growth also suggests that customers are committing to Chart for the long term, enhancing the business’s predictability. 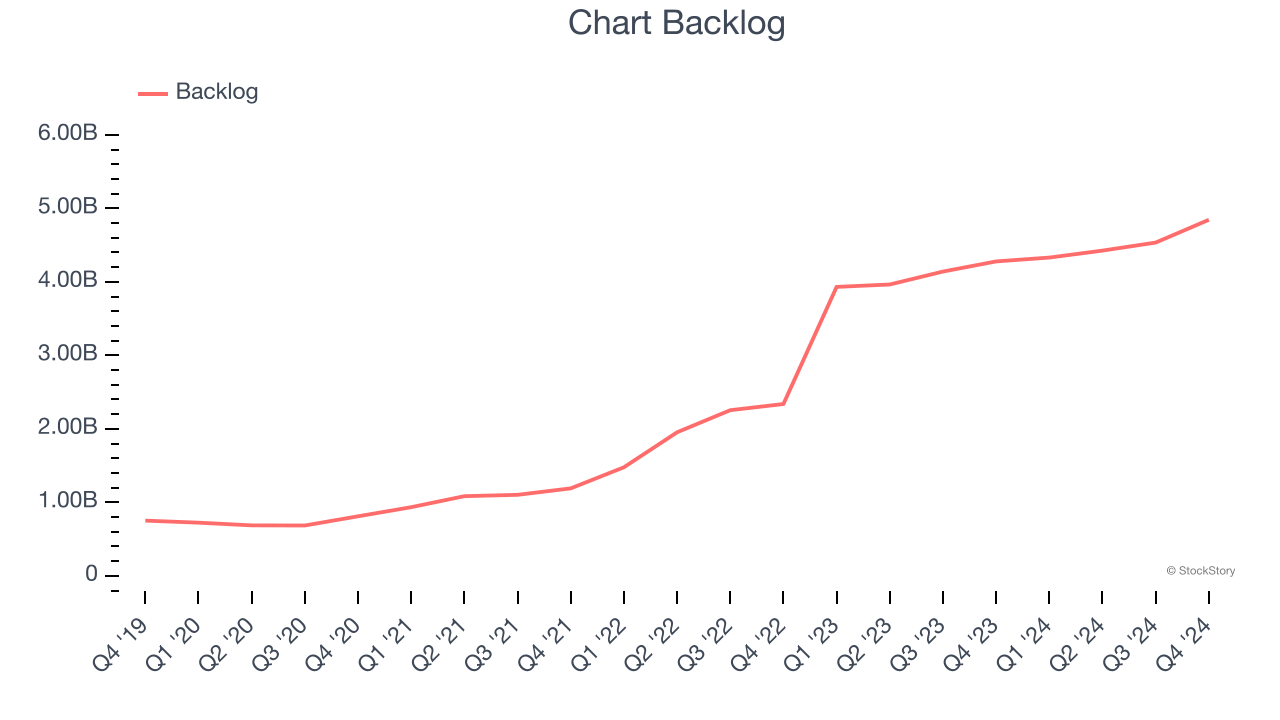
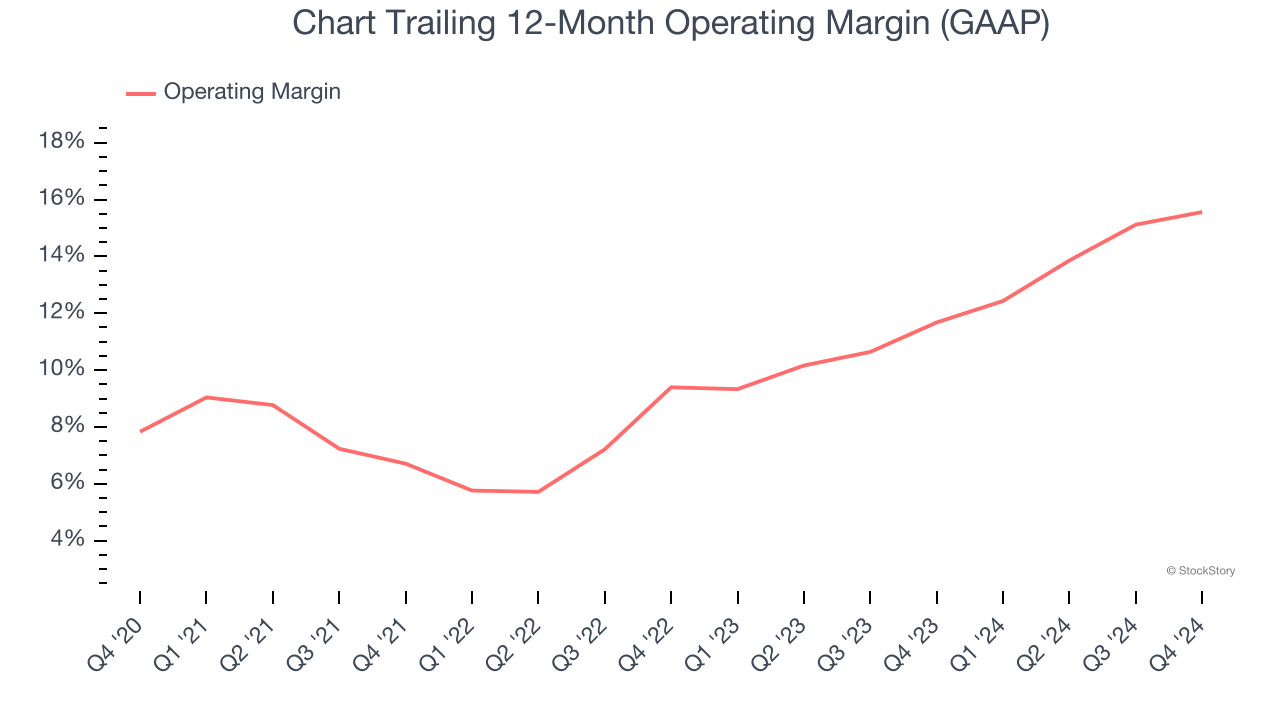
2. Operating Margin Rising, Profits Up
Operating margin is a key measure of profitability. Think of it as net income - the bottom line - excluding the impact of taxes and interest on debt, which are less connected to business fundamentals.
Analyzing the trend in its profitability, Chart’s operating margin rose by 7.7 percentage points over the last five years, as its sales growth gave it immense operating leverage. Its operating margin for the trailing 12 months was 15.6%.
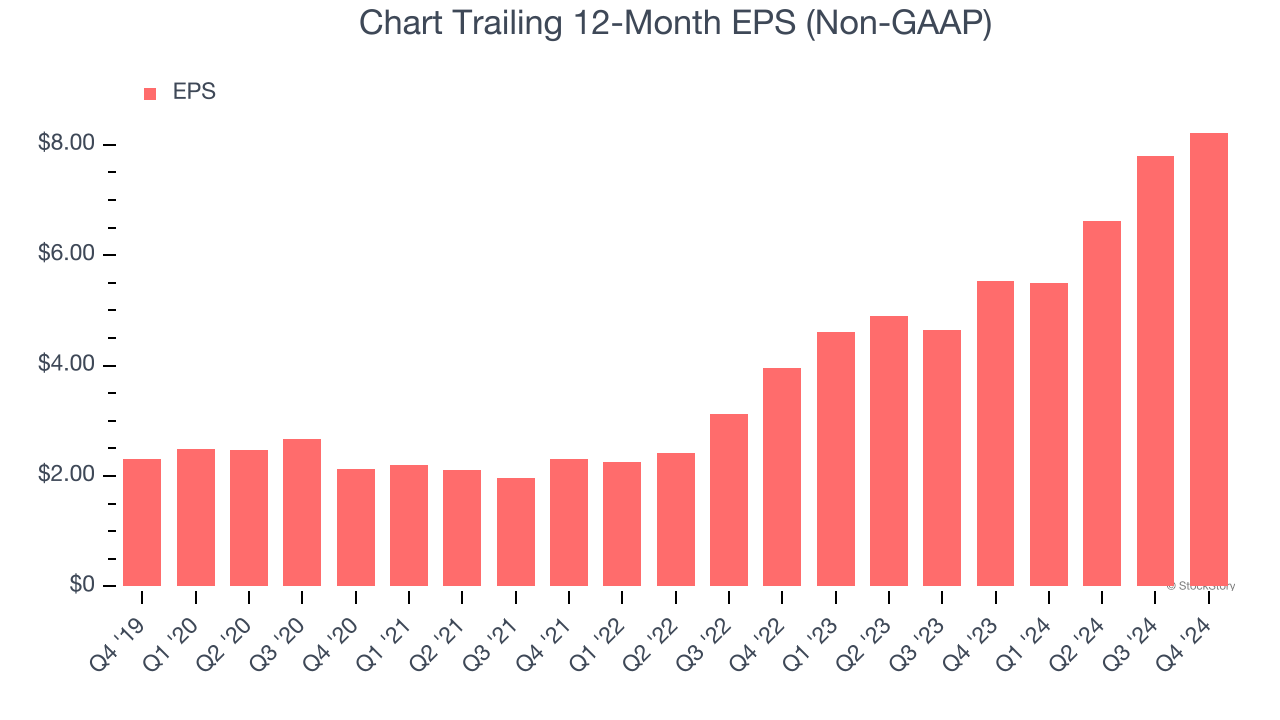
3. Outstanding Long-Term EPS Growth
We track the long-term change in earnings per share (EPS) because it highlights whether a company’s growth is profitable.
Chart’s astounding 28.8% annual EPS growth over the last five years aligns with its revenue performance. This tells us its incremental sales were profitable.
Final Judgment
These are just a few reasons Chart is a high-quality business worth owning, and after its recent outperformance in a weaker market environment, the stock trades at 10.4× forward price-to-earnings (or $127 per share). Is now the time to initiate a position? See for yourself in our comprehensive research report, it’s free.
Stocks We Like Even More Than Chart
Market indices reached historic highs following Donald Trump’s presidential victory in November 2024, but the outlook for 2025 is clouded by new trade policies that could impact business confidence and growth.
While this has caused many investors to adopt a "fearful" wait-and-see approach, we’re leaning into our best ideas that can grow regardless of the political or macroeconomic climate. Take advantage of Mr. Market by checking out our Top 5 Growth Stocks for this month. This is a curated list of our High Quality stocks that have generated a market-beating return of 175% over the last five years.
Stocks that made our list in 2019 include now familiar names such as Nvidia (+2,183% between December 2019 and December 2024) as well as under-the-radar businesses like Sterling Infrastructure (+1,096% five-year return). Find your next big winner with StockStory today for free.


