Medical tech company CONMED (NYSE: CNMD) announced better-than-expected revenue in Q4 CY2024, with sales up 5.8% year on year to $345.9 million. On the other hand, the company’s full-year revenue guidance of $1.36 billion at the midpoint came in 2.7% below analysts’ estimates. Its non-GAAP profit of $1.34 per share was 11.4% above analysts’ consensus estimates.
Is now the time to buy CONMED? Find out by accessing our full research report, it’s free.
CONMED (CNMD) Q4 CY2024 Highlights:
- Revenue: $345.9 million vs analyst estimates of $340.7 million (5.8% year-on-year growth, 1.5% beat)
- Adjusted EPS: $1.34 vs analyst estimates of $1.20 (11.4% beat)
- Adjusted EBITDA: $80.04 million vs analyst estimates of $73.88 million (23.1% margin, 8.3% beat)
- Management’s revenue guidance for the upcoming financial year 2025 is $1.36 billion at the midpoint, missing analyst estimates by 2.7% and implying 3.9% growth (vs 5% in FY2024)
- Adjusted EPS guidance for the upcoming financial year 2025 is $4.33 at the midpoint, missing analyst estimates by 8.7%
- Operating Margin: 15.2%, in line with the same quarter last year
- Constant Currency Revenue rose 6% year on year (31.5% in the same quarter last year)
- Market Capitalization: $2.25 billion
“2024 was a year of solid sales and earnings growth but was also challenging as we navigated persistent supply challenges for parts of our business. I am pleased with our progress in the fourth quarter, particularly with respect to our improved profitability,” commented Patrick J. Beyer, CONMED’s President and Chief Executive Officer.
Company Overview
Founded in 1970, CONMED (NYSE: CNMD) designs, manufactures, and sells surgical and patient care products, specializing in minimally invasive solutions for orthopedic, general, and endoscopic surgery.
Surgical Equipment & Consumables - Diversified
The surgical equipment and consumables industry provides tools, devices, and disposable products essential for surgeries and medical procedures. These companies therefore benefit from relatively consistent demand, driven by the ongoing need for medical interventions, recurring revenue from consumables, and long-term contracts with hospitals and healthcare providers. However, the high costs of R&D and regulatory compliance, coupled with intense competition and pricing pressures from cost-conscious customers, can constrain profitability. Over the next few years, tailwinds include aging populations, which tend to need surgical interventions at higher rates. The increasing integration of AI and robotics into surgical procedures could also create opportunities for differentiation and innovation. However, the industry faces headwinds including potential supply chain vulnerabilities, evolving regulatory requirements, and more widespread efforts to make healthcare less costly.
Sales Growth
Examining a company’s long-term performance can provide clues about its quality. Any business can put up a good quarter or two, but the best consistently grow over the long haul. Over the last five years, CONMED grew its sales at a mediocre 6.5% compounded annual growth rate. This fell short of our benchmark for the healthcare sector and is a tough starting point for our analysis.
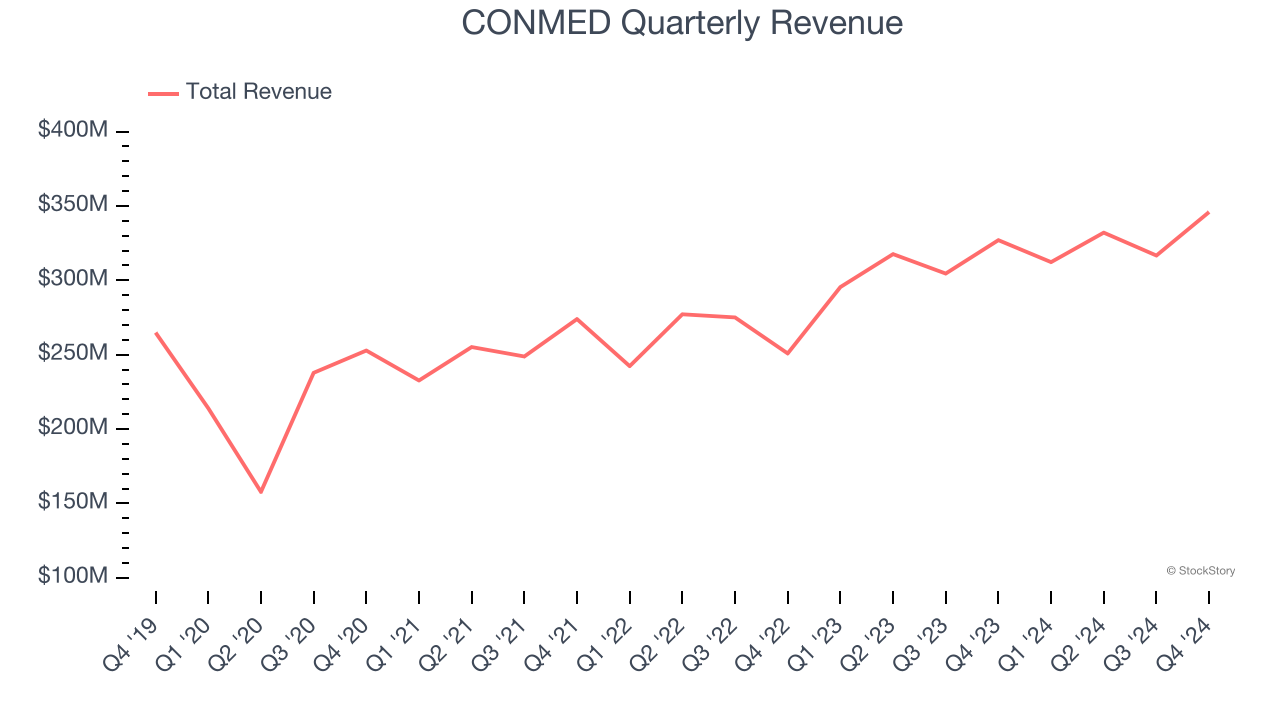
Long-term growth is the most important, but within healthcare, a half-decade historical view may miss new innovations or demand cycles. CONMED’s annualized revenue growth of 11.8% over the last two years is above its five-year trend, suggesting some bright spots. 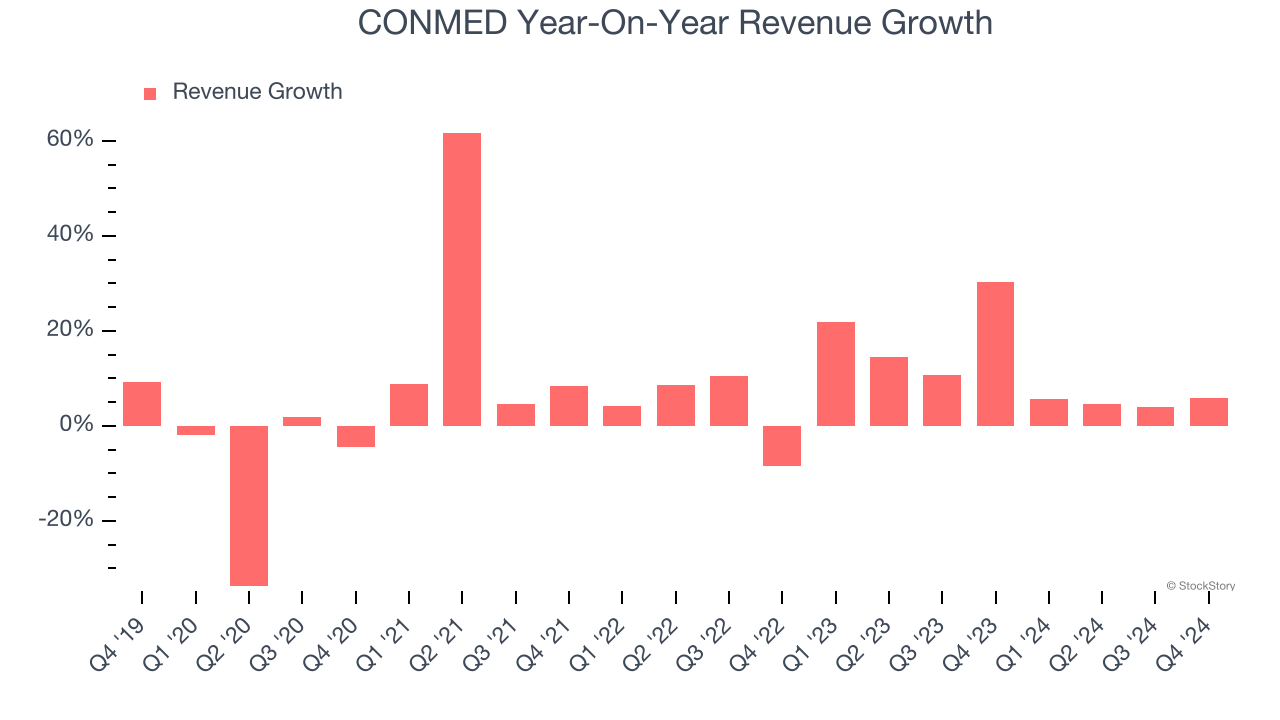
We can better understand the company’s sales dynamics by analyzing its constant currency revenue, which excludes currency movements that are outside their control and not indicative of demand. Over the last two years, its constant currency sales averaged 13.3% year-on-year growth. Because this number aligns with its normal revenue growth, we can see CONMED’s foreign exchange rates have been steady. 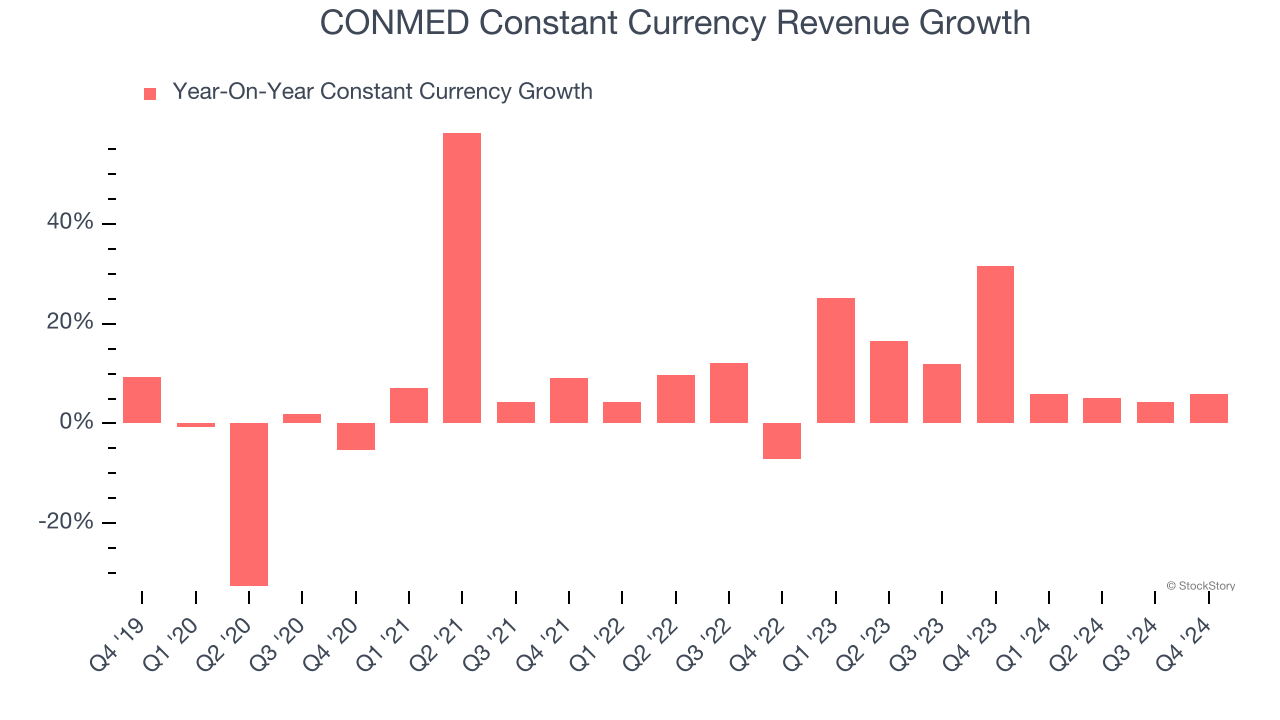
This quarter, CONMED reported year-on-year revenue growth of 5.8%, and its $345.9 million of revenue exceeded Wall Street’s estimates by 1.5%.
Looking ahead, sell-side analysts expect revenue to grow 6.5% over the next 12 months, a deceleration versus the last two years. Still, this projection is above average for the sector and indicates the market sees some success for its newer products and services.
Here at StockStory, we certainly understand the potential of thematic investing. Diverse winners from Microsoft (MSFT) to Alphabet (GOOG), Coca-Cola (KO) to Monster Beverage (MNST) could all have been identified as promising growth stories with a megatrend driving the growth. So, in that spirit, we’ve identified a relatively under-the-radar profitable growth stock benefiting from the rise of AI, available to you FREE via this link.
Adjusted Operating Margin
Adjusted operating margin is a key measure of profitability. Think of it as net income (the bottom line) excluding the impact of non-recurring expenses, taxes, and interest on debt - metrics less connected to business fundamentals.
CONMED has done a decent job managing its cost base over the last five years. The company has produced an average adjusted operating margin of 13.5%, higher than the broader healthcare sector.
Analyzing the trend in its profitability, CONMED’s adjusted operating margin rose by 3 percentage points over the last five years. Zooming in on its more recent performance, we can see the company’s trajectory is intact as its margin has also increased by 1.1 percentage points on a two-year basis.
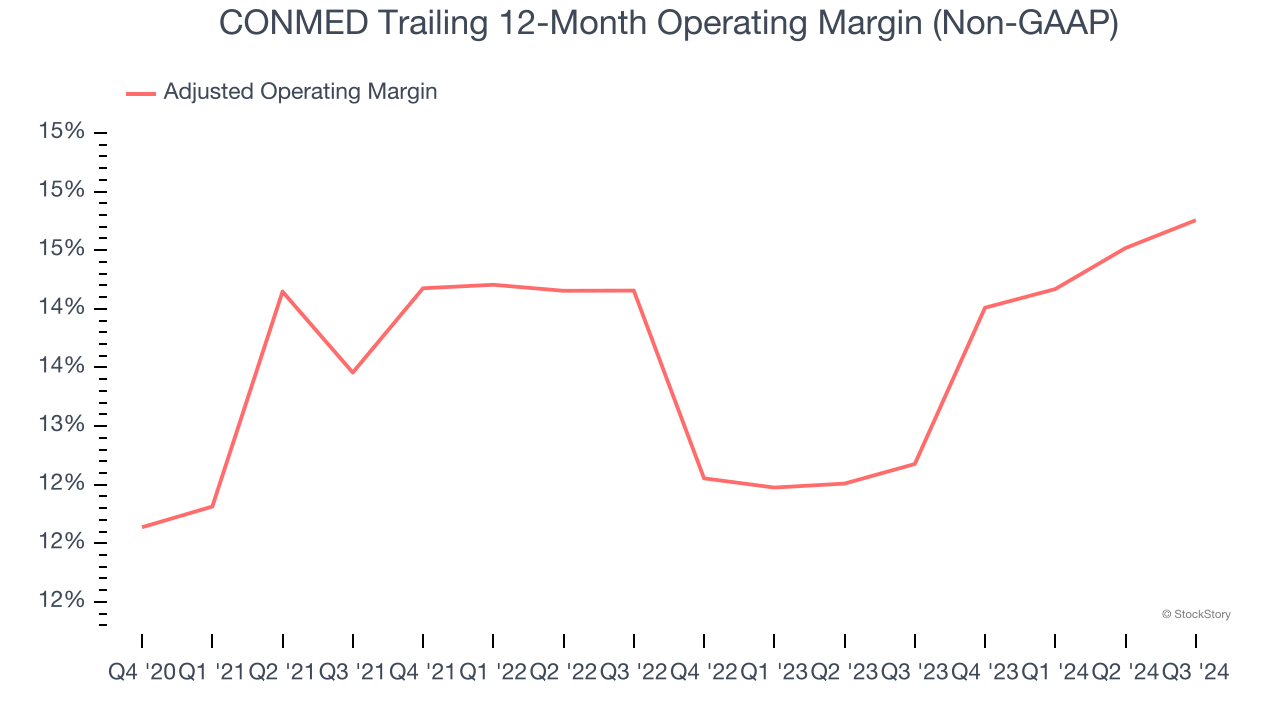
In Q4, CONMED generated an adjusted operating profit margin of 23.1%, up 7.3 percentage points year on year. This increase was a welcome development and shows it was recently more efficient because its expenses grew slower than its revenue.
Earnings Per Share
Revenue trends explain a company’s historical growth, but the long-term change in earnings per share (EPS) points to the profitability of that growth – for example, a company could inflate its sales through excessive spending on advertising and promotions.
CONMED’s EPS grew at a remarkable 9.4% compounded annual growth rate over the last five years, higher than its 6.5% annualized revenue growth. This tells us the company became more profitable on a per-share basis as it expanded.
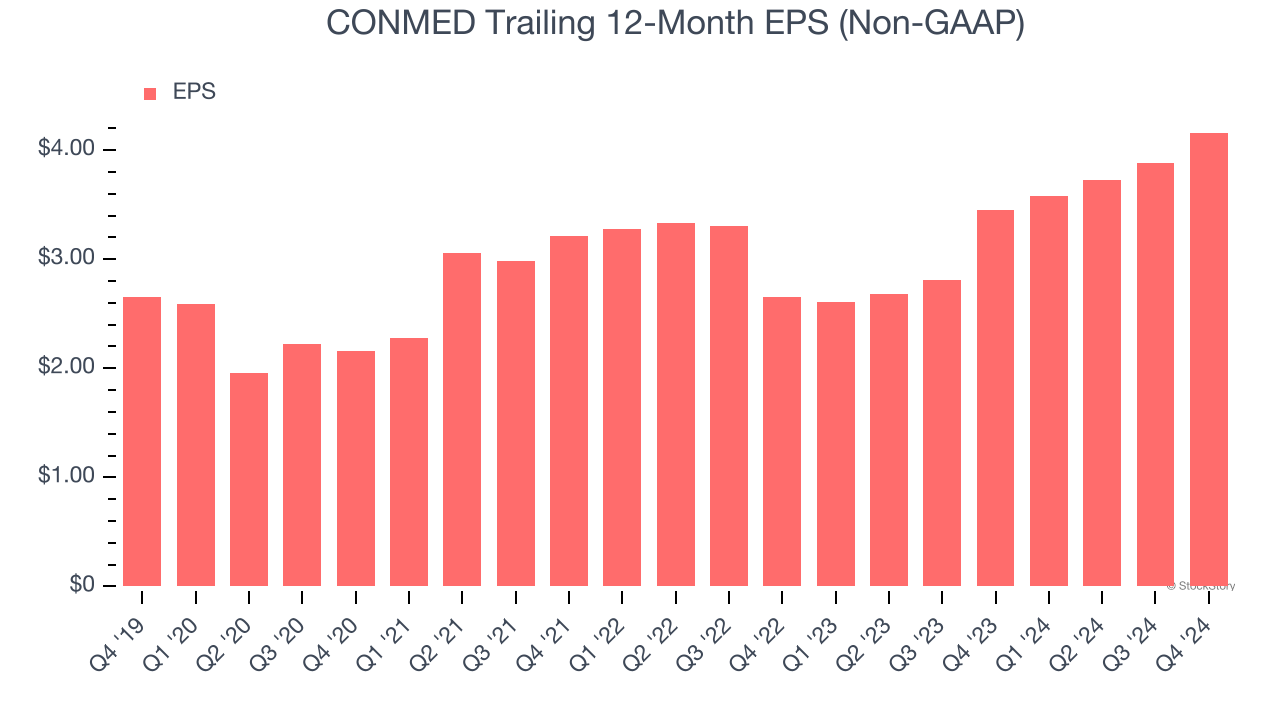
Diving into the nuances of CONMED’s earnings can give us a better understanding of its performance. As we mentioned earlier, CONMED’s adjusted operating margin expanded by 3 percentage points over the last five years. This was the most relevant factor (aside from the revenue impact) behind its higher earnings; taxes and interest expenses can also affect EPS but don’t tell us as much about a company’s fundamentals.
In Q4, CONMED reported EPS at $1.34, up from $1.06 in the same quarter last year. This print easily cleared analysts’ estimates, and shareholders should be content with the results. Over the next 12 months, Wall Street expects CONMED’s full-year EPS of $4.16 to grow 13.6%.
Key Takeaways from CONMED’s Q4 Results
We enjoyed seeing CONMED exceed analysts’ constant currency revenue, EPS, and EBITDA expectations this quarter. On the other hand, its full-year revenue and EPS guidance fell well short of Wall Street’s estimates, dampening the results. The stock traded down 9.9% to $67 immediately after reporting.
CONMED underperformed this quarter, but does that create an opportunity to invest right now? If you’re making that decision, you should consider the bigger picture of valuation, business qualities, as well as the latest earnings. We cover that in our actionable full research report which you can read here, it’s free.