Water technology company Xylem (NYSE: XYL) reported Q4 CY2024 results beating Wall Street’s revenue expectations, with sales up 6.5% year on year to $2.26 billion. On the other hand, the company’s full-year revenue guidance of $8.65 billion at the midpoint came in 2.1% below analysts’ estimates. Its non-GAAP profit of $1.18 per share was 4.9% above analysts’ consensus estimates.
Is now the time to buy Xylem? Find out by accessing our full research report, it’s free.
Xylem (XYL) Q4 CY2024 Highlights:
- Revenue: $2.26 billion vs analyst estimates of $2.18 billion (6.5% year-on-year growth, 3.4% beat)
- Adjusted EPS: $1.18 vs analyst estimates of $1.13 (4.9% beat)
- Adjusted EBITDA: $473 million vs analyst estimates of $456.1 million (21% margin, 3.7% beat)
- Management’s revenue guidance for the upcoming financial year 2025 is $8.65 billion at the midpoint, missing analyst estimates by 2.1% and implying 1% growth (vs 18.6% in FY2024)
- Adjusted EPS guidance for the upcoming financial year 2025 is $4.60 at the midpoint, missing analyst estimates by 1.9%
- Operating Margin: 11.8%, up from 10% in the same quarter last year
- Free Cash Flow Margin: 21.1%, up from 17% in the same quarter last year
- Organic Revenue rose 7% year on year (9% in the same quarter last year)
- Market Capitalization: $29.83 billion
“The team delivered a strong fourth quarter to close a record-breaking year for Xylem,” said Matthew Pine, Xylem’s CEO.
Company Overview
Formed through a spinoff, Xylem (NYSE: XYL) manufactures and services engineered products across a wide variety of applications primarily in the water sector.
Water Infrastructure
Trends towards conservation and reducing groundwater depletion are putting water infrastructure and treatment products front and center. Companies that can innovate and create solutions–especially automated or connected solutions–to address these thematic trends will create incremental demand and speed up replacement cycles. On the other hand, water infrastructure and treatment companies are at the whim of economic cycles. Consumer spending and interest rates, for example, can greatly impact the industrial production that drives demand for these companies’ offerings.
Sales Growth
Reviewing a company’s long-term sales performance reveals insights into its quality. Any business can have short-term success, but a top-tier one grows for years. Over the last five years, Xylem grew its sales at a solid 10.3% compounded annual growth rate. Its growth beat the average industrials company and shows its offerings resonate with customers, a helpful starting point for our analysis.
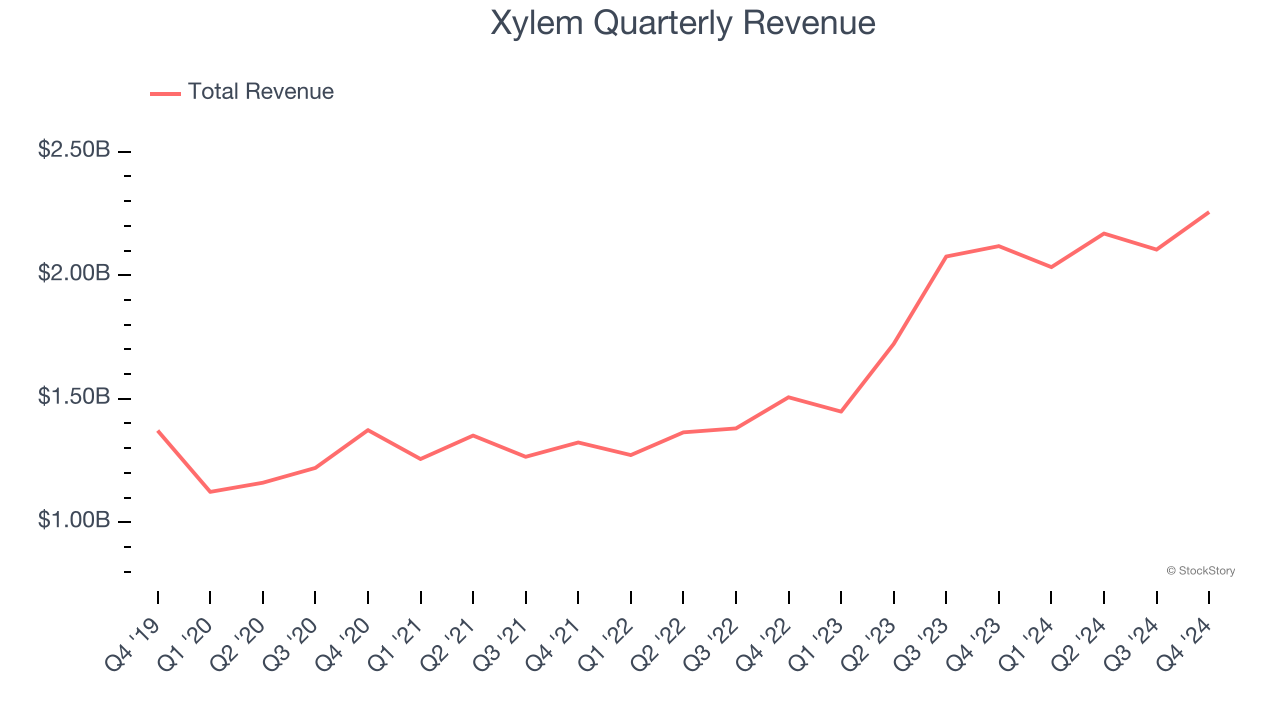
Long-term growth is the most important, but within industrials, a half-decade historical view may miss new industry trends or demand cycles. Xylem’s annualized revenue growth of 24.5% over the last two years is above its five-year trend, suggesting its demand was strong and recently accelerated. 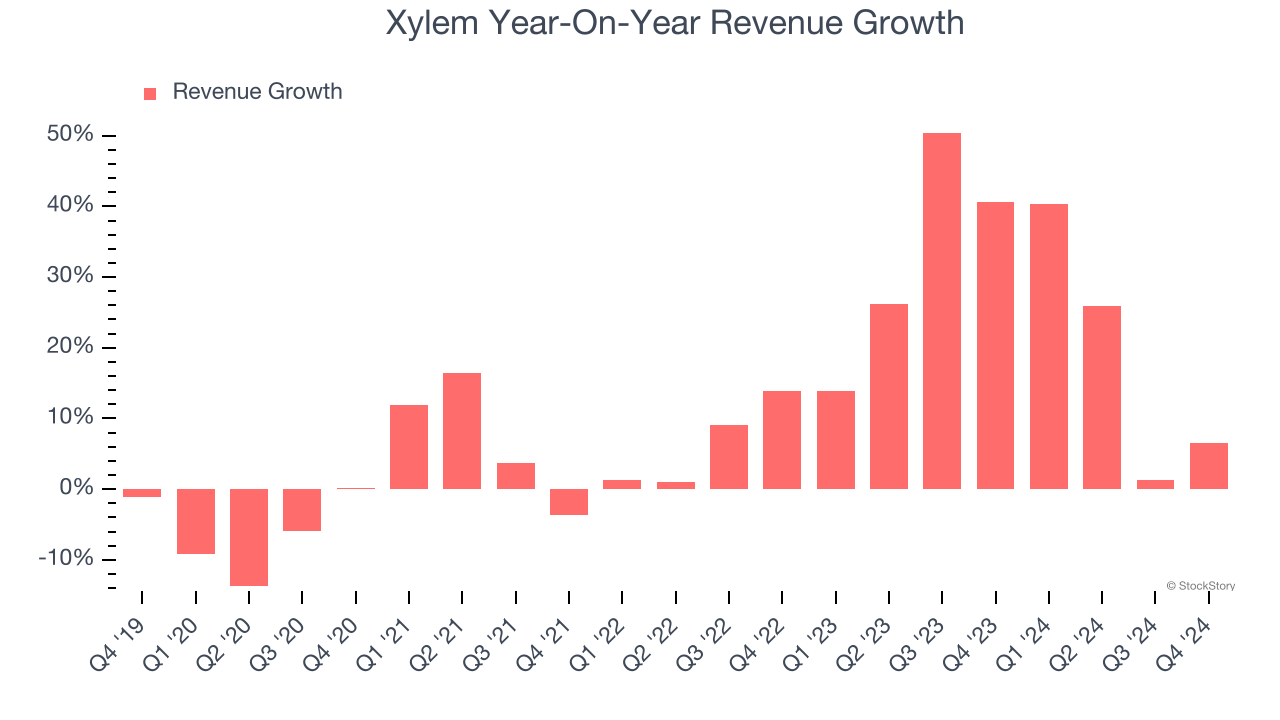
We can better understand the company’s sales dynamics by analyzing its organic revenue, which strips out one-time events like acquisitions and currency fluctuations because they don’t accurately reflect its fundamentals. Over the last two years, Xylem’s organic revenue averaged 9.4% year-on-year growth. Because this number is lower than its normal revenue growth, we can see that some mixture of acquisitions and foreign exchange rates boosted its headline results. 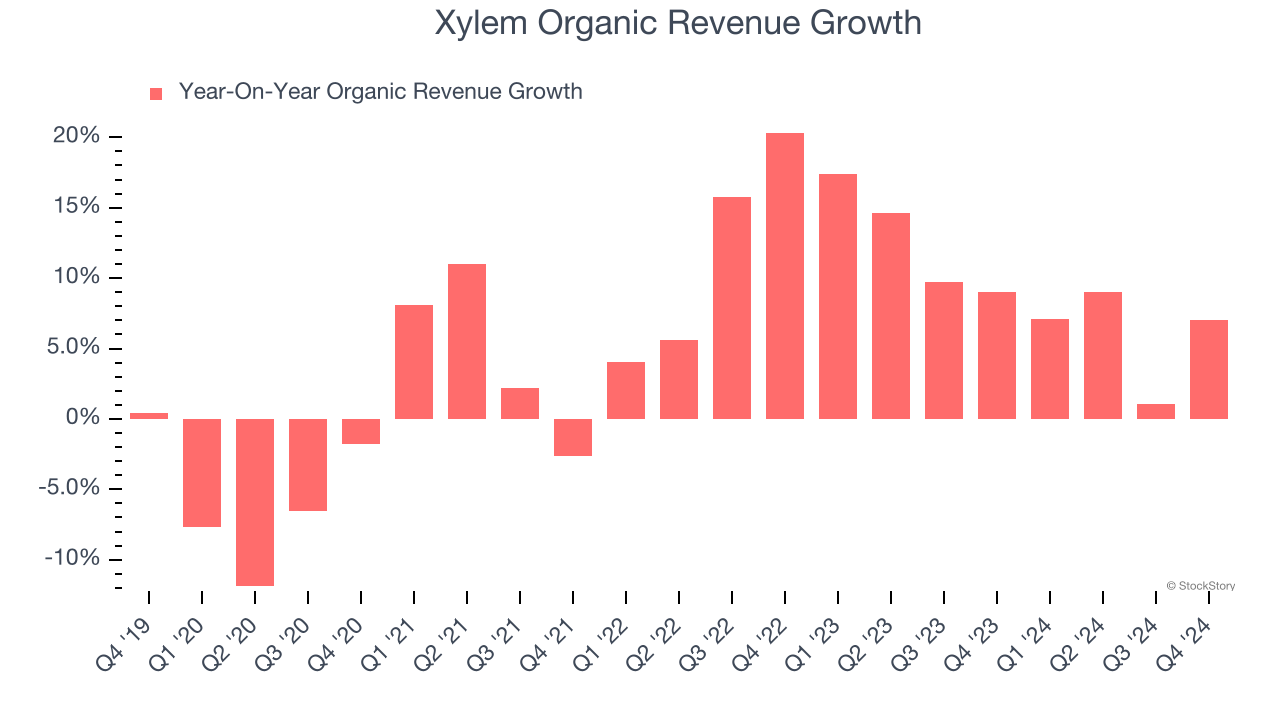
This quarter, Xylem reported year-on-year revenue growth of 6.5%, and its $2.26 billion of revenue exceeded Wall Street’s estimates by 3.4%.
Looking ahead, sell-side analysts expect revenue to grow 3.3% over the next 12 months, a deceleration versus the last two years. This projection is underwhelming and implies its products and services will see some demand headwinds. At least the company is tracking well in other measures of financial health.
Software is eating the world and there is virtually no industry left that has been untouched by it. That drives increasing demand for tools helping software developers do their jobs, whether it be monitoring critical cloud infrastructure, integrating audio and video functionality, or ensuring smooth content streaming. Click here to access a free report on our 3 favorite stocks to play this generational megatrend.
Adjusted Operating Margin
Xylem has managed its cost base well over the last five years. It demonstrated solid profitability for an industrials business, producing an average operating margin of 10.3%. This result isn’t surprising as its high gross margin gives it a favorable starting point.
Looking at the trend in its profitability, Xylem’s operating margin rose by 4.3 percentage points over the last five years, as its sales growth gave it operating leverage.
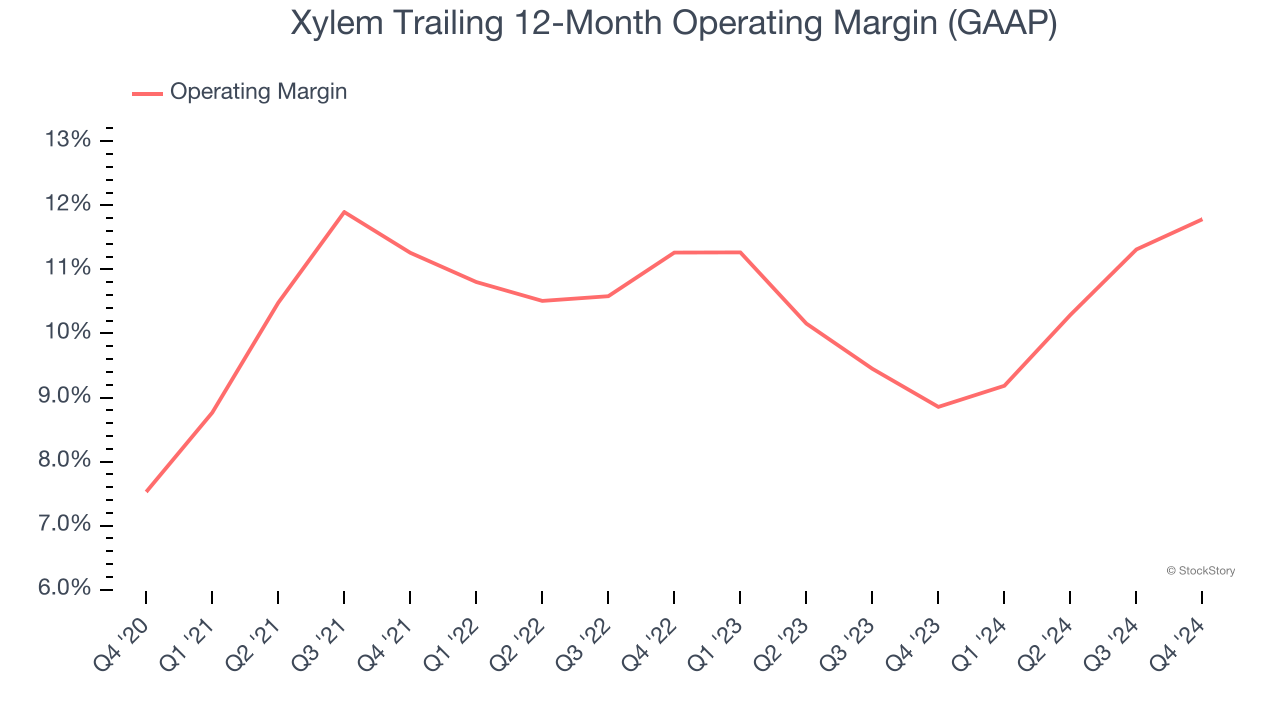
In Q4, Xylem generated an operating profit margin of 11.8%, up 1.9 percentage points year on year. The increase was a welcome development and shows its expenses recently grew slower than its revenue, leading to higher efficiency.
Earnings Per Share
Revenue trends explain a company’s historical growth, but the long-term change in earnings per share (EPS) points to the profitability of that growth – for example, a company could inflate its sales through excessive spending on advertising and promotions.
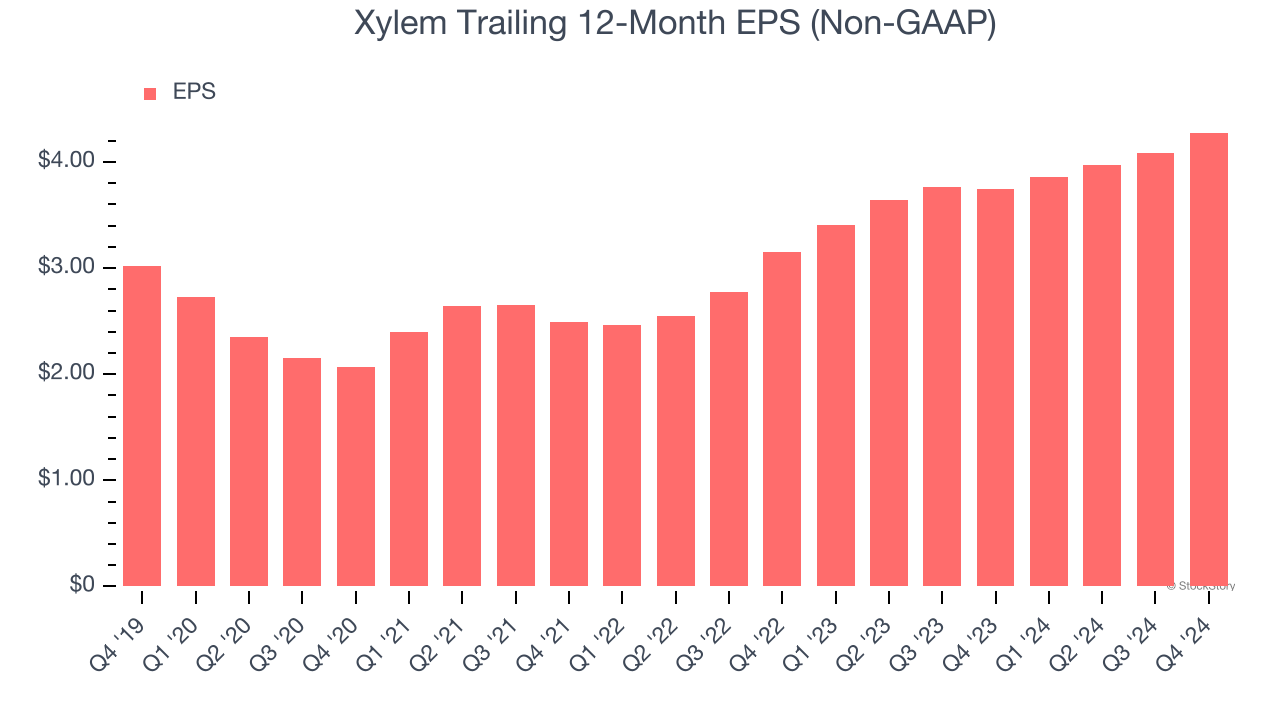
Xylem’s EPS grew at an unimpressive 7.2% compounded annual growth rate over the last five years, lower than its 10.3% annualized revenue growth. However, its operating margin actually expanded during this timeframe, telling us that non-fundamental factors such as interest and taxes affected its ultimate earnings.
Diving into the nuances of Xylem’s earnings can give us a better understanding of its performance. A five-year view shows Xylem has diluted its shareholders, growing its share count by 34.1%. This dilution overshadowed its increased operating efficiency and has led to lower per share earnings. Taxes and interest expenses can also affect EPS but don’t tell us as much about a company’s fundamentals. 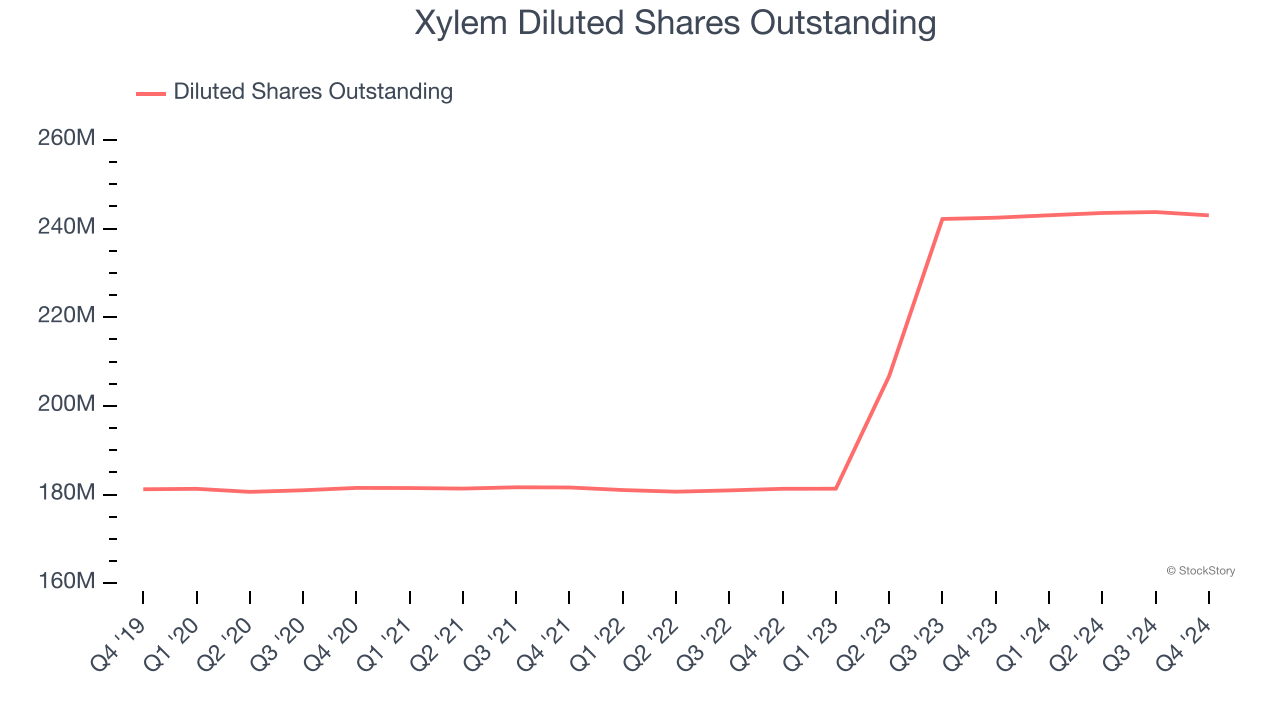
Like with revenue, we analyze EPS over a shorter period to see if we are missing a change in the business.
For Xylem, its two-year annual EPS growth of 16.6% was higher than its five-year trend. This acceleration made it one of the faster-growing industrials companies in recent history.
In Q4, Xylem reported EPS at $1.18, up from $0.99 in the same quarter last year. This print beat analysts’ estimates by 4.9%. Over the next 12 months, Wall Street expects Xylem’s full-year EPS of $4.28 to grow 9.2%.
Key Takeaways from Xylem’s Q4 Results
We were impressed by how significantly Xylem blew past analysts’ organic revenue expectations this quarter. We were also glad its EPS outperformed Wall Street’s estimates. On the other hand, its full-year revenue and EPS guidance missed. Overall, this quarter was mixed. The stock remained flat at $122.20 immediately following the results.
Should you buy the stock or not? When making that decision, it’s important to consider its valuation, business qualities, as well as what has happened in the latest quarter. We cover that in our actionable full research report which you can read here, it’s free.