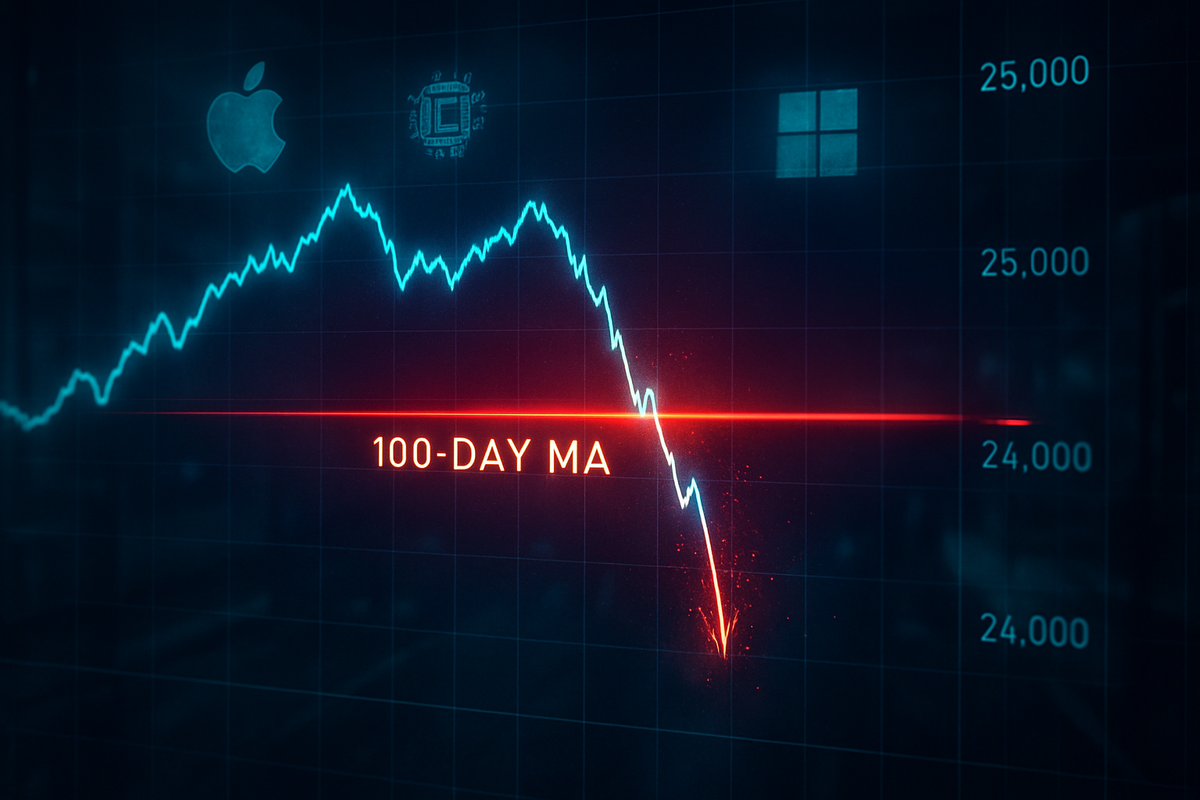
The multi-year dominance of technology equities faced a sobering reality check on March 2, 2026, as the Nasdaq-100 (INDEXNASDAQ: NDX) suffered a decisive technical rejection at its 100-day moving average. The index, which had been flirting with a recovery throughout late February, hit a definitive ceiling near the 25,258 mark before sliding sharply to close at approximately 24,960. This breach of the psychologically significant 25,000 level has signaled a potential shift in market leadership and a cooling of the "AI-at-all-costs" sentiment that defined the previous twenty-four months.
For tech investors, the day's price action represents more than just a momentary dip; it is a technical "failed breakout" that often precedes deeper corrections. As the index settled below its 100-day Simple Moving Average (SMA), market breadth deteriorated, with more than half of the index’s constituents now trading below their respective medium-term trend lines. This sudden loss of momentum has sparked a frantic re-evaluation of portfolio allocations, as the high-valuation growth engines that propelled the market to record highs in 2025 now appear stuck in low gear.
The Rejection at 25,258: A Week of Technical Turmoil
The path to this week’s breakdown began in mid-February when the Nasdaq-100 attempted to stage a rally following a blowout earnings report from Nvidia (NASDAQ: NVDA). While the semiconductor giant posted record revenues, the broader index struggled to maintain its footing above 25,200. On February 27, the index touched the 25,258 level—the precise location of its 100-day moving average—only to be met by a wave of institutional selling. By the time markets opened on March 2, the "risk-off" sentiment had intensified, pushing the index through the 25,000 floor for the first time in months.
Key stakeholders, including institutional asset managers and quantitative hedge funds, appear to have triggered automated sell orders as the index failed to reclaim its 50-day SMA (~25,311) and subsequently lost the 100-day support. The timeline leading to this moment was accelerated by a "perfect storm" of macroeconomic data. Stronger-than-expected labor figures released in late February, coupled with rising energy costs, led the Federal Reserve to signal that interest rate cuts may be delayed until July 2026. This "higher-for-longer" reality hit tech valuations particularly hard, as many companies in the index are priced based on future cash flows that are now being discounted at higher rates.
Initial market reactions have been characterized by a "sell the news" mentality. Even companies delivering positive fundamental data have seen their share prices languish, as investors pivot from growth to preservation. The technical rejection at 25,258 effectively capped the index's upside, leaving it trapped in a downward-sloping channel that technical analysts warn could lead to a test of the 200-day moving average near 25,206—a level that has already been breached on an intraday basis, further weakening the bullish case.
Winners and Losers: The Great AI Rotation
The fallout from the Nasdaq-100’s technical failure has created a stark divergence between "AI Enablers" and "Defensive Havens." Nvidia (NASDAQ: NVDA) has become the poster child for this shift; despite reporting a 73% year-over-year revenue increase, the stock tumbled nearly 9.4% to $177.19 in the final days of February and early March. The rejection below its own 100-day MA suggests that investors are no longer satisfied with "good" earnings and are now demanding extraordinary guidance to justify current multiples. Similarly, Microsoft (NASDAQ: MSFT) has faced pressure as concerns mount over its massive capital expenditures in AI infrastructure, with its forward earnings multiple contracting from 33x to 21x.
Apple (NASDAQ: AAPL) also found itself caught in the crosshairs, trading down roughly 3.2% to $264.18 as it struggled to break above its own technical resistance at $267.83. For these tech titans, the primary challenge is "AI fatigue"—a phase where the market begins to question the immediate return on investment for the billions of dollars being poured into large language models and data centers.
Conversely, the retreat from tech has breathed new life into the "real economy" sectors. Energy and utility stocks have emerged as the primary winners of this volatility. Constellation Energy (NASDAQ: CEG) surged 11.9% in the first week of March, benefiting from its role as a power provider for the very AI data centers that are weighing on tech stock margins. Defensive giants like Walmart (NYSE: WMT) and Exxon Mobil (NYSE: XOM) have also seen inflows, as investors prioritize companies with tangible assets and reliable dividends. This rotation suggests that while the tech-heavy Nasdaq-100 is suffering, the broader market is finding support in sectors that provide essential services and commodities.
Geopolitics and Tariffs: The Macro Catalysts
The technical rejection at 25,258 did not happen in a vacuum. It was heavily influenced by a sharp escalation in geopolitical tensions, specifically a series of military strikes in the Middle East that have sent Brent crude prices surging toward $82 a barrel. This "oil shock" has reignited inflation fears at a time when the market was already fragile. Higher energy costs act as a hidden tax on both consumers and corporations, further squeezing the margins of high-growth tech firms that rely on global supply chains.
Furthermore, the implementation of a 15% universal import tariff has added a layer of complexity to the tech sector’s outlook. For companies like Amazon (NASDAQ: AMZN) and Alphabet (NASDAQ: GOOGL), these tariffs represent a direct hit to the cost of hardware and infrastructure. Analysts note that this policy shift has created a "technical debt" in the market, where previous growth assumptions are being revised downward to account for a more protectionist and inflationary global trade environment.
Historically, such technical rejections often mirror the "dot-com" cooling of the early 2000s or the mid-2022 correction, where a period of extreme exuberance was followed by a return to fundamental valuation metrics. The difference in 2026 is the speed of the market; with algorithmic trading dominating over 80% of daily volume, the breach of the 100-day moving average at 25,258 acted as a digital "tripwire," accelerating the exodus from the Nasdaq-100 and into "safe-haven" assets.
What Comes Next: A Test of the 200-Day Floor
In the short term, the Nasdaq-100 faces a precarious path. If the index cannot reclaim the 25,000 level within the next few trading sessions, the next major support level sits at the 200-day moving average. A failure there would technically confirm a transition into a bear market, potentially forcing a strategic pivot for many growth-focused funds. Investors should expect continued volatility as the market digests upcoming inflation prints and the Federal Reserve’s commentary on interest rate trajectories.
Longer-term, this correction may be a healthy development for the tech sector. By washing out speculative "froth" and forcing companies to demonstrate clear profitability from their AI investments, the market is setting the stage for a more sustainable growth phase. However, the "AI Disruption Trade" is evolving; we are moving from a period where every tech company benefited from AI hype to one where only the most efficient and essential "AI Enablers" will thrive. Strategic adaptations, such as share buybacks and increased focus on data governance, will likely become the new priorities for Silicon Valley leadership.
The Investor’s Wrap-Up
The rejection of the Nasdaq-100 at its 100-day moving average of 25,258 marks a pivotal moment in the 2026 market narrative. The fall below 25,000 is a clear signal that the era of unbridled tech optimism has hit a significant roadblock, driven by a combination of technical exhaustion, geopolitical instability, and shifting monetary policy. For investors, the key takeaway is the importance of diversification and the recognition that "good news" is no longer a guaranteed catalyst for stock price appreciation in an environment of high expectations and rising costs.
Moving forward, the market will likely remain in a "show me" phase. Investors should keep a close watch on the 200-day moving average and the performance of defensive sectors like Utilities and Energy. The ability of Big Tech to translate AI potential into actual bottom-line growth will be the ultimate arbiter of whether this is a temporary dip or the beginning of a prolonged reset. For now, the technical wall at 25,258 stands as a stark reminder that even the most powerful rallies must eventually contend with the gravity of valuation and the reality of the macro environment.
This content is intended for informational purposes only and is not financial advice.