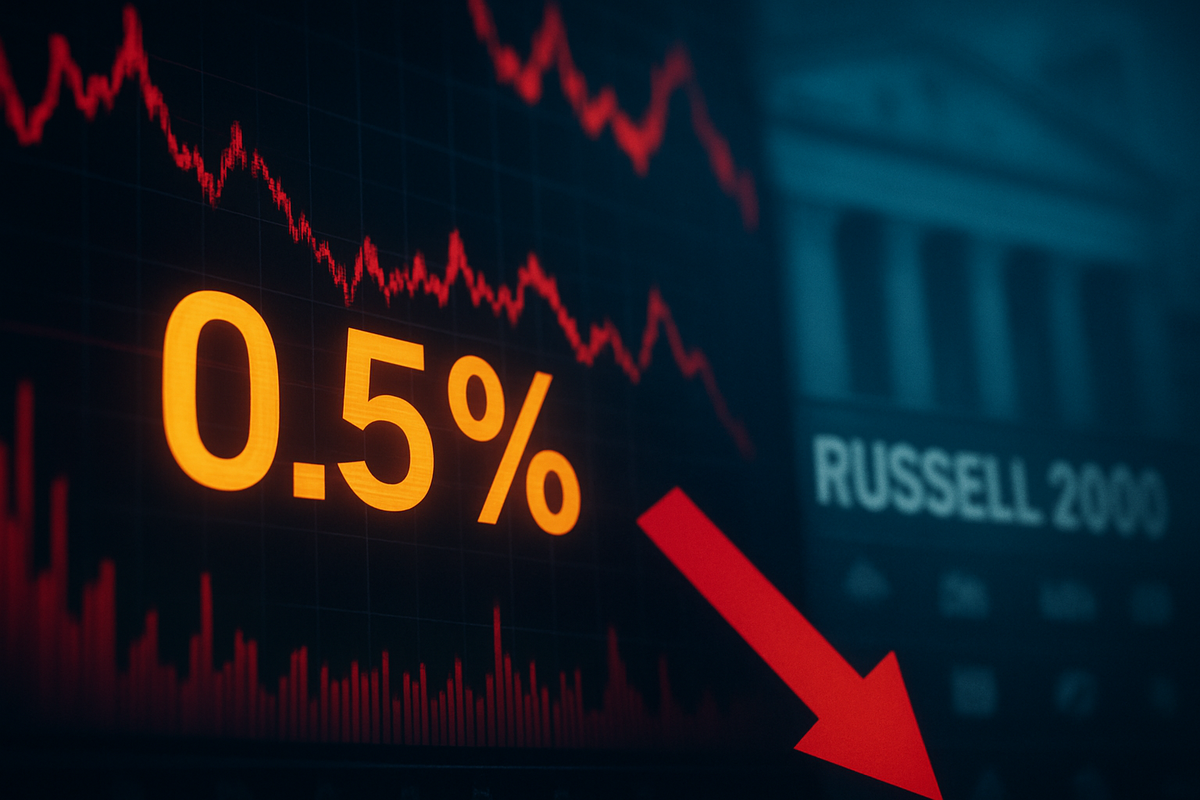
The release of the January Producer Price Index (PPI) report has sent shockwaves through the financial markets, as wholesale inflation rose a staggering 0.5% for the month, significantly outpacing economist estimates of 0.3%. This unexpected jump, reported by the Bureau of Labor Statistics on February 27, 2026, has effectively dismantled the prevailing "soft landing" narrative and reignited fears that price pressures remain deeply entrenched within the American economy.
The immediate fallout was most visible in the equity markets, where the prospect of "higher-for-longer" interest rates triggered a massive sell-off. Small-cap stocks bore the brunt of the damage, with the Russell 2000 Index plunging approximately 2% in a single session. As the market absorbs the reality that the Federal Reserve may remain on the sidelines for much longer than previously anticipated, the optimism that fueled the early-year rally appears to be rapidly evaporating.
Detailed Coverage of the January PPI Spike
The January PPI report, released on the final Friday of February 2026, served as a "gut punch" to investors who had been pricing in a series of interest rate cuts beginning this spring. While the headline figure of 0.5% was concerning, the underlying data was even more alarming: Core PPI, which strips out the volatile food and energy sectors, surged by 0.8%—more than double the 0.3% forecast. This represents the largest monthly gain in core wholesale prices since late 2025, signaling that the "last mile" of the inflation fight is proving to be the most difficult.
The timeline leading up to this moment was characterized by a growing sense of complacency. Throughout January and early February, many analysts suggested that inflation was on a steady, albeit slow, glide path toward the Federal Reserve's 2% target. However, the surge in service-sector costs—specifically margins for professional and commercial equipment wholesaling—revealed that supply chain adjustments and trade tariffs are continuing to exert upward pressure on prices. This data follows a series of "sticky" inflation readings from earlier in the quarter, suggesting that the disinflationary trend observed in 2025 may have stalled.
Market reaction was swift and decisive. The Dow Jones Industrial Average dropped 715 points, a 1.63% decline, while the S&P 500 and the Nasdaq Composite shed 0.94% and 1.08%, respectively. The most dramatic move occurred in the small-cap space, where the iShares Russell 2000 ETF (NYSE Arca: IWM) fell over 2%. Traders immediately adjusted their bets on the Federal Reserve’s next move; swap markets that had previously priced in a rate cut for May or June are now forecasting that the first 25-basis-point reduction may not occur until September 2026.
Winners and Losers in a Volatile Environment
The primary losers in this environment are small-cap companies and the financial institutions that support them. Small-cap firms are typically more sensitive to persistent high interest rates due to their reliance on floating-rate debt and the need for frequent refinancing. As the Russell 2000 tumbled, the SPDR S&P Regional Banking ETF (NYSE Arca: KRE) also saw a sharp decline, as investors feared that prolonged high rates would lead to increased loan defaults and narrowed net interest margins. Regional players like KeyCorp (NYSE: KEY) and Comerica Incorporated (NYSE: CMA) faced significant downward pressure as the "higher-for-longer" reality set in.
Growth-oriented technology stocks, which have high valuations based on future cash flows, also struggled. While industry leaders like Nvidia (NASDAQ: NVDA) and Apple (NASDAQ: AAPL) have historically shown resilience, the broader tech sector felt the weight of rising Treasury yields. High yields make the future earnings of tech companies less attractive in present-value terms, leading to a rotation out of "risk-on" assets. Even mega-cap banks like JPMorgan Chase & Co. (NYSE: JPM) and Goldman Sachs Group Inc. (NYSE: GS) were not immune, as the KBW Bank Index plummeted nearly 6% on fears of a broader economic slowdown.
On the winning side, short-term bond funds and cash-equivalent instruments saw renewed interest as yields spiked. Investors seeking safety moved toward the iShares 20+ Year Treasury Bond ETF (NASDAQ: TLT) and other fixed-income products, though the volatility in yields created a challenging environment for even the most seasoned bond traders. Commodities, particularly those linked to industrial production and energy, may see a speculative boost if the PPI numbers are viewed as a sign of robust (if overheated) demand, though this was largely overshadowed by the broader equity rout.
Wider Significance and Historical Context
This event marks a critical turning point in the post-pandemic economic recovery. The 0.5% PPI jump fits into a broader trend of "sticky services inflation," where costs for healthcare, education, and professional services remain elevated even as goods prices fluctuate. This "inflationary persistence" is a phenomenon that central banks around the world are currently battling. The PPI is a leading indicator for the Personal Consumption Expenditures (PCE) price index—the Federal Reserve's preferred inflation gauge—meaning the "hot" PPI print likely foreshadows a disappointing PCE report later this month.
Historically, the February 2026 market reaction mirrors the "inflation scare" of early 2024. In February 2024, a similarly hot PPI report (0.3% headline vs. 0.1% expected) caused the Russell 2000 to slide 1.4% and pushed rate cut expectations back several months. However, the 2026 event is arguably more significant because it occurs at a time when the market had almost universally expected the Fed to begin its easing cycle. The current data suggests that the "neutral rate" of interest may be higher than policymakers previously thought, necessitating a complete recalibration of monetary policy models.
Furthermore, the impact of trade tariffs and supply chain realignment—once thought to be temporary—is increasingly appearing to be a structural driver of inflation. As companies pass through these higher wholesale costs to consumers, the risk of a "wage-price spiral" remains a top concern for Federal Reserve Chair Jerome Powell and the Federal Open Market Committee (FOMC).
What Comes Next for the Markets
In the short term, all eyes will be on the upcoming March FOMC meeting. While a rate hike remains unlikely, the Fed’s "dot plot" of projected interest rates will be scrutinized for any hawkish shifts. Investors should prepare for continued volatility in small-cap stocks and regional banks, as these sectors will remain the "canary in the coal mine" for interest rate sensitivity. If upcoming labor market data remains strong alongside high inflation, the Federal Reserve will have little choice but to maintain its restrictive stance well into the second half of the year.
Longer term, companies may be forced to undergo strategic pivots to protect their margins. For small-caps, this could mean aggressive cost-cutting or a shift toward less capital-intensive business models. For investors, the era of "easy money" and rapid rate cuts seems to be firmly in the rearview mirror. We may see a "flight to quality," where capital flows toward large-cap companies with strong balance sheets and consistent cash flow, such as the tech giants and established industrial leaders, while speculative ventures face a funding drought.
Summary and Investor Outlook
The January PPI report has delivered a stark reminder that the battle against inflation is far from over. With a headline increase of 0.5% and a core surge of 0.8%, the data has forced a dramatic repricing of risk across all asset classes. The 2% slide in the Russell 2000 highlights the vulnerability of small-cap stocks to a high-rate environment, while the postponement of rate cut expectations to September 2026 underscores the Federal Reserve's difficult path forward.
Moving forward, the market is likely to remain data-dependent and highly reactive to any signs of inflationary pressure. Investors should keep a close watch on the PCE index release and the Fed's commentary in the coming weeks. The primary takeaway is clear: the road to 2% inflation is proving to be long and winding, and the "higher-for-longer" mantra is no longer just a warning—it is the market's new reality.
This content is intended for informational purposes only and is not financial advice.