
As the S&P 500 (NYSEARCA:SPY) hovers near the psychological 7,000-point milestone, the equity market has entered a period of deceptive calm. After a blistering start to 2026, the index has settled into a tight trading range, prompting questions about whether the bull market is finally catching its breath or preparing for a deeper pullback. However, according to Bank of America Corp (NYSE: BAC) Chief Technical Strategist Paul Ciana, this sideways movement is not a sign of exhaustion, but rather a "coiling" effect that could soon launch the index toward a fresh record high.
In a widely circulated research note published on February 20, 2026, Ciana detailed a "correction through time" narrative, arguing that the market is working off its overbought conditions by trading laterally rather than dropping in price. This consolidation, characterized by shrinking volatility and narrowing price action, has set the stage for what technical analysts call a "spring-loaded" breakout. For investors, the message is clear: the underlying structure remains bullish, with tactical targets now firmly set between 7,168 and 7,206.
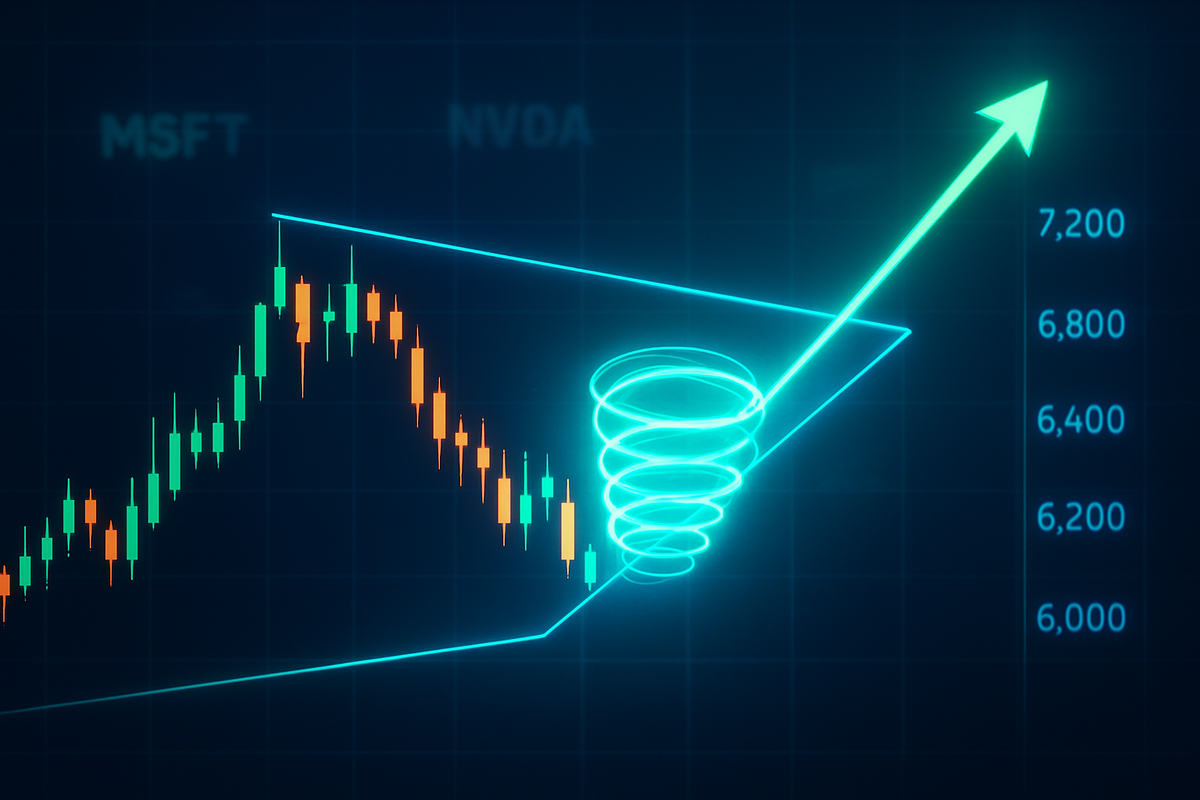
The Technical Blueprint: Coiling and Compression
The "coiling" phenomenon described by Ciana is a result of extreme volatility compression across multiple asset classes. Following the S&P 500’s breach of 7,000 in late January, the index has been trapped in a symmetrical triangle—a pattern where higher lows and lower highs converge toward an apex. Ciana noted that this pattern often precedes an "impulsive and chasable" breakout. This "correction through time" is a healthy development for a market that has seen double-digit gains in a matter of months, allowing moving averages to catch up to the current price and flushing out short-term speculative excess without damaging the long-term uptrend.
Crucial to this outlook is the identified support floor near 6,750. Ciana labeled this level as a "critical line in the sand" for the primary uptrend. Tactically, he pointed to 6,720 as a secondary "warning shot" level; a daily close below this mark would suggest that the coiling pattern has broken to the downside, potentially exposing the 200-day moving average currently situated near 6,525. However, as of late February, the index remains comfortably above these danger zones, reinforcing the thesis that the path of least resistance remains higher once the current consolidation phase concludes.
The Winners and Losers of the "Great Convergence"
The current technical setup is being fueled by a massive internal rotation that Ciana and other analysts have dubbed the "Great Convergence." For much of the past two years, the market was dominated by a handful of tech titans. However, early 2026 has seen a shift toward the "Other 493." While Microsoft Corp (NASDAQ: MSFT) and NVIDIA Corp (NASDAQ: NVDA) have entered their own periods of price consolidation amid "CAPEX fatigue" and massive $5 trillion valuations, the Invesco S&P 500 Equal Weight ETF (NYSEARCA:RSP) has begun to outperform its market-cap-weighted counterparts.
This rotation is creating clear winners in the "real economy" sectors. Energy and Materials companies are thriving as investors move into the second phase of the AI infrastructure buildout—focused not just on chips, but on the power and raw materials needed to run them. Conversely, traditional Software-as-a-Service (SaaS) firms have faced headwinds as "Agentic AI" disruptions threaten legacy licensing models. Furthermore, the iShares Russell 2000 ETF (NYSEARCA:IWM) has emerged as a major beneficiary of the coiling S&P 500, as capital flows into smaller, undervalued stocks that are projected to see nearly 19% earnings growth in 2026 compared to the broader index’s 12.5%.
A Structural Shift in Market Breadth
The significance of Ciana’s "coiling" narrative extends beyond simple chart patterns; it reflects a fundamental improvement in market health. Historically, narrow markets led by a few stocks are prone to sudden collapses. In contrast, the current environment shows that nearly 68% of S&P 500 constituents are trading above their 200-day moving averages. This broad participation provides a "cushion" for the index; even as Apple Inc (NASDAQ: AAPL) trades flat while navigating new AI partnership deals, strength in Industrials and Financials keeps the aggregate index buoyant.
This trend mirrors previous historical "mid-cycle" consolidations, such as those seen in the late 1990s or mid-2010s, where a period of sideways trading laid the groundwork for the next multi-year leg of the bull market. The macro backdrop of 2026—characterized by a Federal Reserve nearing a "neutral" interest rate of approximately 2.75% and stabilizing, albeit "sticky," inflation—provides the necessary liquidity to support higher valuations. The "coiling" effect suggests that the market is simply digesting these macro realities before the next surge.
Scenarios: The Path to 7,200 and Beyond
In the short term, the market is looking for a catalyst to trigger the breakout from the 7,168–7,206 target range. Investors should keep a close eye on upcoming manufacturing data and the next round of corporate earnings, which will determine if the "Great Convergence" can maintain its momentum. If the S&P 500 successfully clears the 7,100 hurdle, the move to 7,200 could happen rapidly as short-sellers are forced to cover and momentum-following algorithms trigger buy orders.
Alternatively, if the index fails to hold the 6,750 support level, the "coiled spring" could release to the downside. Strategic pivots would then be required, with a focus on defensive sectors like Consumer Staples and Utilities. However, given the current earnings growth projections and the strength of the labor market in early 2026, many analysts view a potential dip below 6,700 as a "generational buying opportunity" rather than the start of a bear market.
Final Outlook: Tactical Patience in a Range-Bound World
The S&P 500 is currently in a state of high-tension equilibrium. Paul Ciana’s analysis highlights that while the lack of upward movement in February might feel frustrating to aggressive bulls, it is a necessary component of a sustainable long-term rally. The "correction through time" allows for the normalization of valuations and the broadening of market leadership, both of which are essential for the index to eventually target levels beyond 7,500 later in the year.
Investors should maintain tactical patience while the "coiling" process completes. The key levels to watch are 6,750 on the downside and 7,100 on the upside. As long as the floor holds, the technical evidence suggests that the S&P 500 is merely gathering strength for its next major ascent. In the coming months, the focus will likely remain on whether the "Other 493" can carry the torch as mega-cap tech enters a more mature, stable phase of its growth cycle.
This content is intended for informational purposes only and is not financial advice.


