Big box consumer electronics retailer Best Buy Co. Inc. (NYSE: BBY) may be the last of its kind as the nation's largest standalone pure-play consumer electronics chain. A tough macroeconomic environment has caused consumers to tighten their wallet strings on discretionary retail products. Consumers have shifted their discretionary spending to services like NASDAQ: UAL">travel and NASDAQ: ABNB">vacations and away from apparel and electronics. This has been documented with many retailers as they struggle with inventory issues and sagging margins. However, normalization is concluding, as evidenced by Best Buy's latest quarter and forecasts.
While revenues still fell 7.2% and comparable same-store sales were down 6.2%, gross margins did improve 110 bps. This was driven by strength in video games offsetting weakness in appliances, home theaters, computers and mobile phone sales. Management feels the worst is behind them and expects consumer electronics demand to recover by the end of its fiscal 2024.
Weathering the Fog
On August 8, 2023, Best Buy released its fiscal second-quarter 2024 results for the 13 weeks ending July 29, 2023. The Company reported earnings-per-share (EPS) of $1.22, excluding non-recurring items, versus consensus analyst estimates for a profit of $1.06, a 22-cent beat. EPS fell by 21% from the year-ago same period. Revenues fell 7.2% year-over-year (YoY) to $9.58 billion, beating consensus analyst estimates for $9.52 billion.
Weakest Links
The largest comparable sales declines came from post-pandemic normalization in appliances, home theater, computing and mobile phones, which were partially offset by growth in gaming. However, gross profit margins improved to 23.1% versus 22% domestically due to its membership growth and improved gross profit rates from its Health initiatives. Management feels this will be the low point for technology demand and should see recovery accelerating. This coincides with many other technology companies echoing the same sentiment. Memory chip maker Micron Technology Inc. (NYSE: MU) noted in its Q2 2023 earnings that it expects chip demand to grow in the second half of 2023.
Inline Guidance
Best Buy raised its lower end of fiscal full-year 2024 EPS guidance to $6.00 to $6.40 from $5.70 to $6.50 versus $6.07 consensus analyst estimates. It expects fiscal full-year 2024 revenues of $43.8 billion to $44.5 billion versus $44.25 billion. Comparable same-store sales are expected to decline 4.5% to 6% compared to prior estimates of a decline of 3% to 6%.
CEO Insights
CEO Corie Barry commented, "… we continue to expect this year to be the low point in tech demand after two years of sales declines. Next year, the consumer electronics industry should see stabilization and possibly growth driven by the natural upgrade and replacement cycles and the normalization of tech innovation." He noted that inventory levels were down from the year-ago period and in line with its sales decline. They are strategically managing inventory levels, targeting 60 days of forward supply.
Analyst Actions
Many analysts took action after the fiscal Q2 2024 earnings report. Goldman Sachs raised its rating on Best Buy shares to a BUY and its price target to $79 from $77. Morgan Stanley increased its price target to $80 from $75 per share and an Equal Weight rating. UBS cut its price target to $85 from $87 per share.
Best Buy analyst ratings and price targets are at MarketBeat.
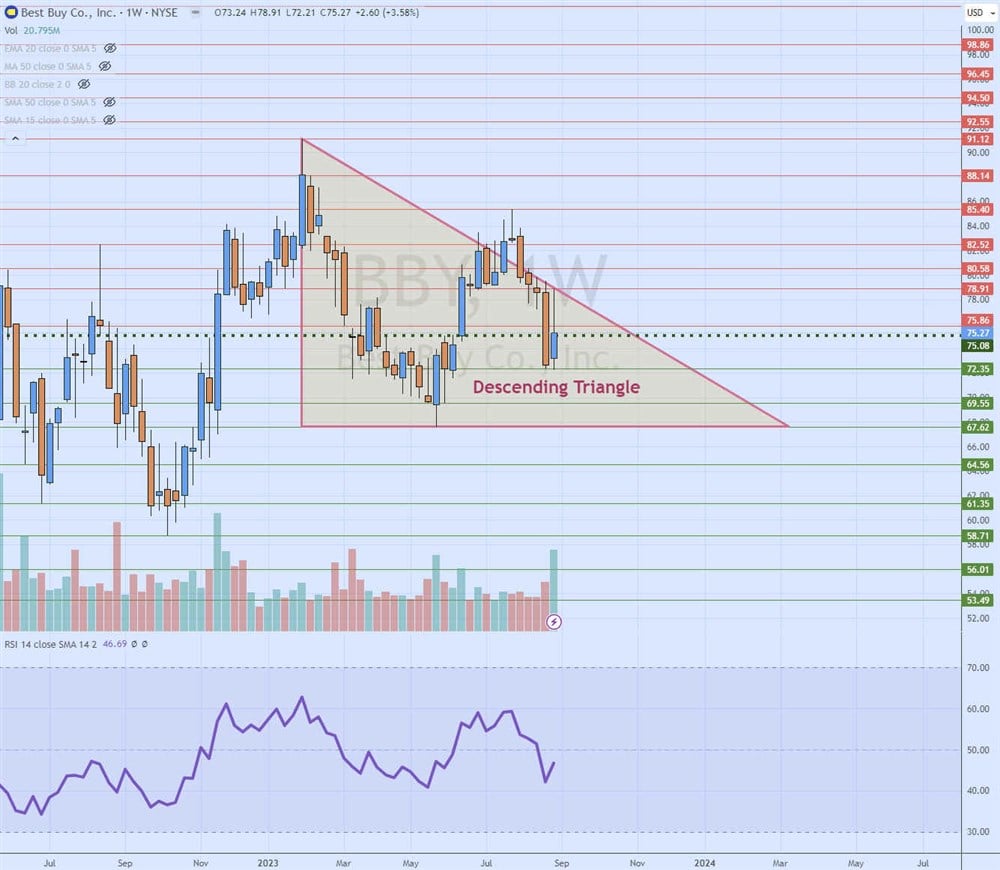
Weekly Descending Triangle
The weekly candlestick chart on BBY illustrates a descending triangle pattern that commenced after peaking at $91.12 in January 2023. BBY fell to a low of $67.62 by May 2023. BBY triggered the weekly market structure low (MSL) breakout through the $75.08 trigger in an attempt to break out through the descending triangle, which it did, peaking at $85.40 in July 2023 before falling back in the triangle. Each bounce attempt afterward was met with resistance on the descending trendline at lower highs as shares eventually collapsed under the weekly MSL trigger on its fiscal Q2 2024 earnings release. The relative strength index (RSI) oscillator attempts to bounce back towards the 50-band. Pullback support levels are $72.35, $69.55, $67.62 flat-bottom horizontal triangle trendline and $64.56.