SHANGHAI, March 27, 2025 (GLOBE NEWSWIRE) -- Jiayin Group Inc. (“Jiayin” or the “Company”) (NASDAQ: JFIN), a leading fintech platform in China, today announced its unaudited financial results for the fourth quarter and fiscal year ended December 31, 2024.
Fourth Quarter 2024 Operational and Financial Highlights:
- Loan facilitation volume1 was RMB27.7 billion (US$3.8 billion), representing an increase of 37.8% from the same period of 2023.
- Average borrowing amount per borrowing was RMB7,807 (US$1,070), representing a decrease of 21.5% from the same period of 2023.
- Repeat borrowing rate2 was 69.9%, compared with 72.9% in the same period of 2023.
- Net revenue was RMB1,404.5 million (US$192.4 million), representing a decrease of 12.2% from the same period of 2023.
- Income from operation was RMB392.6 million (US$53.8 million), compared with RMB232.0 million in the same period of 2023.
- Non-GAAP3 income from operation was RMB402.4 million (US$55.1 million), compared with RMB239.7 million in the same period of 2023.
- Net income was RMB275.5 million (US$37.7 million), representing a decrease of 25.1% from RMB367.6 million in the same period of 2023.
Full Year 2024 Operational and Financial Highlights:
- Loan facilitation volume1 was RMB100.8 billion (US$13.8 billion), representing an increase of 14.4% from RMB88.1 billion in 2023.
- Average borrowing amount per borrowing was RMB8,536 (US$1,169), representing a decrease of 17.3% from RMB10,318 in 2023.
- Net revenue was RMB5,801.0 million (US$794.7 million), representing an increase of 6.1% from RMB5,466.9 million in 2023.
- Repeat borrowing rate2 was 66.8%, compared with 70.6% in 2023.
- Income from operation was RMB1,248.0 million (US$171.0 million), compared with RMB1,332.5 million in 2023.
- Non-GAAP income from operation3 was RMB1,307.1 million (US$179.1 million), compared with RMB1,386.8 million in 2023.
- Net income was RMB1,056.5 million (US$144.7 million), compared with RMB1,297.6 million in 2023.
Mr.Yan Dinggui, the Company’s Founder, Director and Chief Executive Officer, commented: “In 2024, amid a complex market landscape environment filled with both challenges and opportunities, we maintained sustainable business performance through our innovation-driven strategy, optimizing services and customer segments. For the fiscal year ended December 31, 2024, our loan facilitation volume was RMB100.8 billion, representing an increase of 14.4% year-over-year while net revenue grew 6.1% to RMB5,801.0 million.
Among the year’s primary initiatives, we extensively leveraged artificial intelligence (AI) technology across various aspects of our business. Our strategic priorities and risk management practices have enabled us to maintain sustainable business performance while delivering value to stakeholders. Strong performance enabled cash dividends totaling US$0.5 per American depositary share in 2024. The total aggregate amount of cash distributed was approximately US$26.6 million in 2024, representing 15.0% of net income after tax of the Company in fiscal year 2023. We expect to continue returning more value to shareholders by maintaining or increasing dividend when market conditions improve.
Moving forward, we will accelerate global expansion, diversify funding, and advance AI adoption. Prudent operations and robust risk management underscored our business resilience. Our adaptable model and commitment to sustainable growth position us to seize opportunities and deliver long-term shareholder value.”
__________________________
1 “Loan facilitation volume” refers the loan volume facilitated in Mainland China during the period presented.
2 “Repeat borrowing rate” refers to the number of repeat borrowers in a given period as a percentage of the number of total borrowers in Mainland China who borrowed through us in the same period.
“Repeat borrowers” during a certain period refers to borrowers who have borrowed in such period and have borrowed at least twice since such borrowers’ registration on our platform until the end of such period.
3 Please see the section entitled “Use of Non-GAAP Financial Measure” below and the table captioned “Unaudited Reconciliations of GAAP and Non-GAAP Results” set forth at the end of this press release.
Fourth Quarter 2024 Financial Results
Net revenue was RMB1,404.5 million (US$192.4 million), representing a decrease of 12.2% from the same period of 2023.
Revenue from loan facilitation services was RMB1,124.0 million (US$154.0 million), representing an increase of 46.3% from the same period of 2023. The increase was primarily due to increased loan origination volume from the Company’s institutional funding partners.
Revenue from releasing of guarantee liabilities was RMB156.6 million (US$21.5 million) compared with RMB669.2 million in the same period of 2023. The year-over-year decrease was primarily due to the decrease in average outstanding loan balances for which the Company provided guarantee services.
Other revenue was RMB123.9million (US$16.9 million), representing a decrease of 23.9% from the same period of 2023. The decrease was primarily due to the decrease in revenue generated from oversea loans as a result of disposal of Nigeria entities and the decrease in revenue from investor referral service.
Facilitation and servicing expense was RMB339.3 million (US$46.5 million), representing a decrease of 59.5% from the same period of 2023. This was primarily due to decreased expenses related to financial guarantee services.
Allowance for uncollectible assets, loans receivable and others was RMB1.2 million (US$0.2 million), primarily due to the net impact of current period provision and reversal of allowance for receivables arising from lower expected credit loss rate.
Sales and marketing expense was RMB517.2 million (US$70.9 million), representing an increase of 57.0% from the same period of 2023, primarily due to an increase in borrower acquisition expenses.
General and administrative expense was RMB53.7 million (US$7.4 million), representing a decrease of 17.6% from the same period of 2023, primarily driven by a decrease in employee costs.
Research and development expense was RMB100.4 million (US$13.8 million), representing an increase of 8.1% from the same period of 2023, primarily due to the increase in the number of our research and development personnel.
Income from operation was RMB392.6 million (US$53.8 million), compared with RMB232.0 million in the same period of 2023.
Non-GAAP income from operation was RMB402.4 million (US$55.1 million), compared with RMB239.7 million in the same period of 2023.
Net income was RMB275.5 million (US$37.7 million), representing a decrease of 25.1% from RMB367.6 million in the same period of 2023.
Basic and diluted net income per share was RMB1.30 (US$0.18), compared with RMB1.72 in the fourth quarter of 2023.
Basic and diluted net income per ADS was RMB5.20 (US$0.72), compared with RMB6.88 in the fourth quarter of 2023. Each ADS represents four Class A ordinary shares of the Company.
Cash and cash equivalents were RMB540.5 million (US$74.0 million) as of December 31, 2024, compared with RMB741.2 million as of September 30, 2024.
Full Year 2024 Financial Results
Net revenue was RMB5,801.0 million (US$794.7 million), representing an increase of 6.1% from RMB5,466.9 million in 2023.
Revenue from loan facilitation services was RMB4,011.8 million (US$549.6 million), representing an increase of 15.0% from 2023. The increase was primarily due to the increased loan facilitation volume from the Company’s institutional funding partners.
Revenue from releasing of guarantee liabilities was RMB1,357.7 million (US$186.0 million), representing a decrease of 2.5% from 2023. The year-over-year decrease was primarily due to the decrease in average outstanding loan balances for which the Company provided guarantee services.
Other revenue was RMB431.5 million (US$59.1 million), representing a decrease of 26.2% from 2023. The decrease was mainly driven by the decrease in revenue from investor referral service.
Facilitation and servicing expense was RMB2,033.5 million (US$278.6 million), representing an increase of 1.1% from 2023. This was primarily due to the effect of increased loan facilitation volume, which was partially offset by the decreased expenses related to financial guarantee services.
Allowance for uncollectible assets, loans receivable and others was RMB12.2 million (US$1.7 million), representing a decrease of 83.2% from 2023, primarily due to the decrease in loans receivable as a result of disposal of Nigeria entities in 2024.
Sales and marketing expense was RMB1,913.9 million (US$262.2 million), representing an increase of 24.4% from 2023, primarily due to an increase in borrower acquisition expenses in 2024.
General and administrative expense was RMB221.0 million (US$30.3 million), representing an increase of 2.8% from 2023, primarily driven by the increased professional service fees.
Research and development expense was RMB372.4 million (US$51.0 million), representing an increase of 25.7% from 2023, primarily due to the higher employee compensation and benefit expenses.
Income from operation was RMB1,248.0 million (US$171.0 million), representing a decrease of 6.3% from RMB1,332.5 million in 2023.
Non-GAAP income from operation was RMB1,307.1 million (US$179.1 million), representing a decrease of 5.7% from RMB1,386.8 million in 2023.
Net income was RMB1,056.5 million (US$144.7 million), representing a decrease of 18.6% from RMB1,297.6 million in 2023.
Basic and diluted net income per share was RMB4.97 (US$0.68), compared with RMB6.06 in 2023.
Basic and diluted net income per ADS was RMB19.88 (US$2.72), compared with RMB24.24 in 2023. Each ADS represents four Class A ordinary shares of the Company.
The following table provides the delinquency rates of all outstanding loans on the Company’s platform in Mainland China as of the respective dates indicated.
| Delinquent for | ||||||
| As of | 1-30 days | 31-60 days | 61-90 days | 91 -180 days | More than 180 days | |
| (%) | ||||||
| December 31, 2021 | 1.31 | 0.90 | 0.72 | 1.78 | 2.12 | |
| December 31, 2022 | 1.01 | 0.67 | 0.51 | 1.18 | 2.02 | |
| December 31, 2023 | 1.13 | 0.90 | 0.68 | 1.48 | 2.07 | |
| March 31, 2024 | 0.99 | 0.85 | 0.68 | 1.63 | 2.62 | |
| June 30, 2024 | 0.96 | 0.83 | 0.67 | 1.61 | 2.60 | |
| September 30, 2024 | 0.93 | 0.76 | 0.55 | 1.32 | 2.49 | |
| December 31, 2024 | 1.02 | 0.79 | 0.53 | 1.16 | 2.36 | |
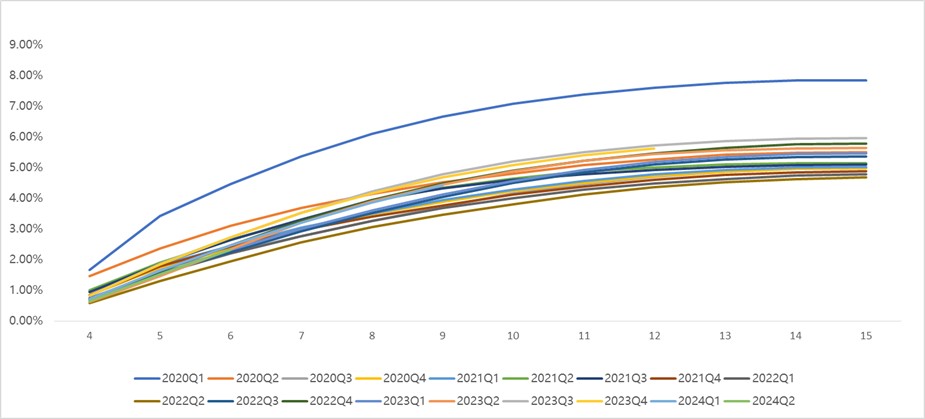
The following chart and table display the historical cumulative M3+ Delinquency Rate by Vintage for loan products facilitated through the Company’s platform in Mainland China.
Business Outlook
The Company expects its loan facilitation volume for the full year of 2025 to be in the range of RMB137.0 billion to RMB142.0 billion, its loan facilitation volume for the first quarter of 2025 to be around RMB35 billion and its Non-GAAP income from operation for the first quarter of 2025 to be in the range of RMB0.57 billion to RMB0.63 billion. This forecast reflects the Company’s current and preliminary views on the market and operational conditions, which are subject to change.
Recent Development
Dividend Policy
The board of directors of the Company (the “Board”) previously approved and adopted a dividend policy on March 28, 2023, (the “Prior Dividend Policy”) under which the Company may choose to declare and distribute a cash dividend twice each fiscal year, starting from 2023, at an aggregate amount of no less than 15% of the net income after tax of the Company in the previous fiscal year.
On November 19, 2024, the Board approved and adopted an amended dividend policy (the “Existing Dividend Policy”) to replace the Company’s Prior Dividend Policy in its entirety, with immediate effect. Under the Existing Dividend Policy, the Company may choose to declare and distribute a cash dividend once each fiscal year, starting from 2025, at an aggregate amount of no less than 15% of the net income after tax of the Company in the previous fiscal year.
On March 27, 2025, in order to provide investors with higher returns, the Board approved and adopted a further adjustment to the Existing Dividend Policy to increase the annual dividend amount such that the Company may choose to declare and distribute a cash dividend once each fiscal year, starting from 2025, at an aggregate amount of around 30% of the net income after tax of the Company in the previous fiscal year. The determination to make dividend distributions in any particular fiscal year will be made at the discretion of the Board based upon factors such as the Company’s results of operations, cash flow, general financial condition, capital requirements, contractual restrictions and other factors as the Board may deem relevant.
Share Repurchase Plan Update
In March 2024, the Company’s Board of Directors approved an adjustment to the existing share repurchase plan, pursuant to which the aggregate value of ordinary shares authorized for repurchase under the plan shall not exceed US$30 million.
On June 4, 2024, the Company’s Board of Directors approved to extend the share repurchase plan for a period of 12 months, commencing on June 13, 2024, and ending on June 12, 2025. Pursuant to the extended share repurchase plan, the Company may repurchase its ordinary shares through June 12, 2025, with an aggregate value not exceeding the remaining balance under the share repurchase plan. As of March 27, 2025, the Company had repurchased approximately 3.8 million of its ADSs for approximately US$16.8 million.
Purchase of Commercial Property
As previously announced, the Company entered into a definitive agreement on December 17, 2024 to purchase certain commercial property located in Shanghai, China (the “Commercial Property”) of approximately 43,500 square meters for total cash consideration of approximately RMB1.35 billion. In March 2025, the Company completed the purchase of, and obtained title to, the Commercial Property. The Commercial Property will primarily be used as the Company's new headquarters to meet the demand arising from the continuing growth of the Company’s businesses.
Conference Call
The Company will conduct a conference call to discuss its financial results on Thursday, March 27, 2025, at 8:00 AM U.S. Eastern Time (8:00 PM Beijing/Hong Kong Time on the same day).
To join the conference call, all participants must use the following link to complete the online registration process in advance. Upon registering, each participant will receive access details for this event including the dial-in numbers, a PIN number, and an e-mail with detailed instructions to join the conference call.
Participant Online Registration:
https://register-conf.media-server.com/register/BIf67b7a559deb42d587e943f572275713
A live and archived webcast of the conference call will be available on the Company’s investors relations website at https://ir.jiayintech.cn/.
About Jiayin Group Inc.
Jiayin Group Inc. is a leading fintech platform in China committed to facilitating effective, transparent, secure and fast connections between underserved individual borrowers and financial institutions. The origin of the business of the Company can be traced back to 2011. The Company operates a highly secure and open platform with a comprehensive risk management system and a proprietary and effective risk assessment model which employs advanced big data analytics and sophisticated algorithms to accurately assess the risk profiles of potential borrowers. For more information, please visit https://ir.jiayintech.cn/.
Use of Non-GAAP Financial Measure
We use non-GAAP income from operation, which is a non-GAAP financial measure, in evaluating our operating results and for financial and operational decision-making purposes. We believe that the non-GAAP financial measure helps identify underlying trends in our business by excluding the impact of share-based compensation expenses. We believe that non-GAAP financial measure provides useful information about our operating results, enhances the overall understanding of our past performance and future prospects and allows for greater visibility with respect to key metrics used by our management in its financial and operational decision-making.
Non-GAAP income from operation represents income from operation excluding share-based compensation expenses. Such adjustment has no impact on income tax.
Non-GAAP income from operation is not defined under U.S. GAAP and is not presented in accordance with U.S. GAAP. The non-GAAP financial measure has limitations as analytical tool, and when assessing our operating performance, cash flows or our liquidity, investors should not consider it in isolation, or as a substitute for income from operation, net income, cash flows provided by operating activities or other consolidated statements of operation and cash flow data prepared in accordance with U.S. GAAP. The Company encourages investors and others to review our financial information in its entirety and not rely on a single financial measure.
For more information on this non-GAAP financial measure, please see the table captioned “Unaudited Reconciliations of GAAP and Non-GAAP results” set forth at the end of this press release.
Exchange Rate Information
This announcement contains translations of certain RMB amounts into U.S. dollars (“US$”) at a specified rates solely for the convenience of the reader. Unless otherwise noted, all translations from RMB to U.S. dollars are made at a rate of RMB7.2993 to US$1.00, the exchange rate set forth in the H.10 statistical release of the Board of Governors of the Federal Reserve System as of December 31, 2024. The Company makes no representation that the RMB or US$ amounts referred could be converted into US$ or RMB, as the case may be, at any particular rate or at all.
Safe Harbor / Forward-Looking Statements
This announcement contains forward-looking statements. These statements are made under the “safe harbor” provisions of the United States Private Securities Litigation Reform Act of 1995. These forward-looking statements can be identified by terminology such as “will,” “expects,” “anticipates,” “future,” “intends,” “plans,” “believes,” “estimates” and similar statements. The Company may also make written or oral forward-looking statements in its periodic reports to the SEC, in its annual report to shareholders, in press releases and other written materials and in oral statements made by its officers, directors or employees to third parties. Statements that are not historical facts, including statements about the Company’s beliefs and expectations, are forward-looking statements. Forward-looking statements involve inherent risks and uncertainties and are based on current expectations, assumptions, estimates and projections about the Company and the industry. Potential risks and uncertainties include, but are not limited to, those relating to the Company’s ability to retain existing investors and borrowers and attract new investors and borrowers in an effective and cost-efficient way, the Company’s ability to increase the investment volume and loan facilitation of loans volume facilitated through its marketplace, effectiveness of the Company’s credit assessment model and risk management system, PRC laws and regulations relating to the online individual finance industry in China, general economic conditions in China, and the Company’s ability to meet the standards necessary to maintain listing of its ADSs on the Nasdaq Stock Market or other stock exchange, including its ability to cure any non-compliance with the continued listing criteria of the Nasdaq Stock Market. All information provided in this press release is as of the date hereof, and the Company undertakes no obligation to update any forward-looking statements to reflect subsequent occurring events or circumstances, or changes in its expectations, except as may be required by law. Although the Company believes that the expectations expressed in these forward-looking statements are reasonable, it cannot assure you that its expectations will turn out to be correct, and investors are cautioned that actual results may differ materially from the anticipated results. Further information regarding risks and uncertainties faced by the Company is included in the Company’s filings with the U.S. Securities and Exchange Commission, including its annual report on Form 20-F.
For investor and media inquiries, please contact:
Jiayin Group
Ms. Emily Lu
Email: ir@jiayinfintech.cn
| JIAYIN GROUP INC. UNAUDITED CONDENSED CONSOLIDATED BALANCE SHEETS (Amounts in thousands, except for share and per share data) | ||||||||||||
| As of December 31, | As of December 31, | |||||||||||
| 2023 | 2024 | |||||||||||
| RMB | RMB | US$ | ||||||||||
| ASSETS | ||||||||||||
| Cash and cash equivalents | 370,193 | 540,523 | 74,051 | |||||||||
| Restricted cash | 2,435 | 137,332 | 18,814 | |||||||||
| Accounts receivable and contract assets, net | 2,103,545 | 2,991,166 | 409,788 | |||||||||
| Financial assets receivables, net | 991,628 | 293,483 | 40,207 | |||||||||
| Prepaid expenses and other current assets | 1,922,056 | 377,978 | 51,784 | |||||||||
| Deferred tax assets, net | 61,174 | 72,405 | 9,919 | |||||||||
| Property and equipment, net | 40,332 | 44,397 | 6,082 | |||||||||
| Right-of-use assets | 49,659 | 52,759 | 7,228 | |||||||||
| Long-term investments | 101,481 | 162,267 | 22,230 | |||||||||
| Other non-current assets | 2,263 | 737,583 | 101,048 | |||||||||
| TOTAL ASSETS | 5,644,766 | 5,409,893 | 741,151 | |||||||||
| LIABILITIES AND EQUITY | ||||||||||||
| Deferred guarantee income | 886,862 | 229,503 | 31,442 | |||||||||
| Contingent guarantee liabilities | 933,947 | 213,644 | 29,269 | |||||||||
| Payroll and welfare payable | 94,856 | 144,065 | 19,737 | |||||||||
| Tax payables | 568,819 | 687,034 | 94,123 | |||||||||
| Accrued expenses and other current liabilities | 731,863 | 956,356 | 131,019 | |||||||||
| Lease liabilities | 47,958 | 51,677 | 7,080 | |||||||||
| TOTAL LIABILITIES | 3,264,305 | 2,282,279 | 312,670 | |||||||||
| TOTAL SHAREHOLDERS' EQUITY | 2,380,461 | 3,127,614 | 428,481 | |||||||||
| TOTAL LIABILITIES AND EQUITY | 5,644,766 | 5,409,893 | 741,151 | |||||||||
| JIAYIN GROUP INC. UNAUDITED CONDENSED CONSOLIDATED STATEMENTS OF OPERATIONS AND COMPREHENSIVE INCOME (Amounts in thousands, except for share and per share data) | ||||||||||||||||||
| For the Three Months Ended December 31, | For the Year Ended December 31, | |||||||||||||||||
| 2023 | 2024 | 2023 | 2024 | |||||||||||||||
| RMB | RMB | US$ | RMB | RMB | US$ | |||||||||||||
| Net revenue | 1,600,543 | 1,404,493 | 192,415 | 5,466,873 | 5,801,032 | 794,738 | ||||||||||||
| Operating costs and expenses: | ||||||||||||||||||
| Facilitation and servicing | (837,249 | ) | (339,323 | ) | (46,487 | ) | (2,011,553 | ) | (2,033,511 | ) | (278,590 | ) | ||||||
| Allowance for uncollectible assets, loans receivable and others | (43,753 | ) | (1,211 | ) | (166 | ) | (72,764 | ) | (12,204 | ) | (1,672 | ) | ||||||
| Sales and marketing | (329,453 | ) | (517,208 | ) | (70,857 | ) | (1,538,913 | ) | (1,913,868 | ) | (262,199 | ) | ||||||
| General and administrative | (65,182 | ) | (53,683 | ) | (7,355 | ) | (214,856 | ) | (220,993 | ) | (30,276 | ) | ||||||
| Research and development | (92,917 | ) | (100,427 | ) | (13,758 | ) | (296,317 | ) | (372,441 | ) | (51,024 | ) | ||||||
| Total operating costs and expenses | (1,368,554 | ) | (1,011,852 | ) | (138,623 | ) | (4,134,403 | ) | (4,553,017 | ) | (623,761 | ) | ||||||
| Income from operation | 231,989 | 392,641 | 53,792 | 1,332,470 | 1,248,015 | 170,977 | ||||||||||||
| Gain (loss) from disposal of subsidiaries | 278,219 | (14,431 | ) | (1,977 | ) | 278,219 | (14,431 | ) | (1,977 | ) | ||||||||
| Impairment of long-term investments | (91,236 | ) | (51,923 | ) | (7,113 | ) | (91,236 | ) | (51,923 | ) | (7,113 | ) | ||||||
| Interest income, net | 7,955 | 9,113 | 1,248 | 12,895 | 18,281 | 2,504 | ||||||||||||
| Other income, net | 1,256 | 20,459 | 2,803 | 14,834 | 95,426 | 13,073 | ||||||||||||
| Income before income taxes and share of gain from equity method investments | 428,183 | 355,859 | 48,753 | 1,547,182 | 1,295,368 | 177,464 | ||||||||||||
| Income tax expense | (62,561 | ) | (80,341 | ) | (11,007 | ) | (247,616 | ) | (238,900 | ) | (32,729 | ) | ||||||
| Share of gain (loss) from equity method investments | 2,012 | — | — | (1,990 | ) | — | — | |||||||||||
| Net income | 367,634 | 275,518 | 37,746 | 1,297,576 | 1,056,468 | 144,735 | ||||||||||||
| Less: net loss attributable to noncontrolling interest | (128 | ) | (6 | ) | (1 | ) | (43 | ) | (10 | ) | (1 | ) | ||||||
| Net income attributable to Jiayin Group Inc. | 367,762 | 275,524 | 37,747 | 1,297,619 | 1,056,478 | 144,736 | ||||||||||||
| Weighted average shares used in calculating net income per share: | ||||||||||||||||||
| - Basic and diluted | 213,462,066 | 212,589,379 | 212,589,379 | 213,996,233 | 212,433,169 | 212,433,169 | ||||||||||||
| Net income per share: | ||||||||||||||||||
| - Basic and diluted | 1.72 | 1.30 | 0.18 | 6.06 | 4.97 | 0.68 | ||||||||||||
| Net income per ADS: | ||||||||||||||||||
| - Basic and diluted | 6.88 | 5.20 | 0.72 | 24.24 | 19.88 | 2.72 | ||||||||||||
| Net income | 367,634 | 275,518 | 37,746 | 1,297,576 | 1,056,468 | 144,735 | ||||||||||||
| Other comprehensive income, net of tax of nil: | ||||||||||||||||||
| Foreign currency translation adjustments | (15,146 | ) | 6,720 | 921 | (7,132 | ) | (3,171 | ) | (434 | ) | ||||||||
| Comprehensive income | 352,488 | 282,238 | 38,667 | 1,290,444 | 1,053,297 | 144,301 | ||||||||||||
| Comprehensive (loss) income attributable to noncontrolling interest | (94 | ) | 34 | 5 | (98 | ) | 21 | 3 | ||||||||||
| Total comprehensive income attributable to Jiayin Group Inc. | 352,582 | 282,204 | 38,662 | 1,290,542 | 1,053,276 | 144,298 | ||||||||||||
| JIAYIN GROUP INC. UNAUDITED RECONCILIATIONS OF GAAP AND NON-GAAP RESULTS (Amounts in thousands, except for share and per share data) | ||||||||||||||||||
| For the Three Months Ended December 31, | For the Year Ended December 31, | |||||||||||||||||
| 2023 | 2024 | 2023 | 2024 | |||||||||||||||
| RMB | RMB | US$ | RMB | RMB | US$ | |||||||||||||
| Reconciliation of Non-GAAP income from operation to Income from operation | ||||||||||||||||||
| Income from operation | 231,989 | 392,641 | 53,792 | 1,332,470 | 1,248,015 | 170,977 | ||||||||||||
| Add: share-based compensation expenses | 7,741 | 9,778 | 1,340 | 54,353 | 59,122 | 8,100 | ||||||||||||
| Non-GAAP income from operation | 239,730 | 402,419 | 55,132 | 1,386,823 | 1,307,137 | 179,077 | ||||||||||||
A chart accompanying this announcement is available at https://www.globenewswire.com/NewsRoom/AttachmentNg/7730457e-6d05-48ba-8cc9-125ed6c0a71a

![]()