Commodities like steel (HVH26) are notoriously volatile, as many Barchart readers know. But steel is also viable as a trading asset.
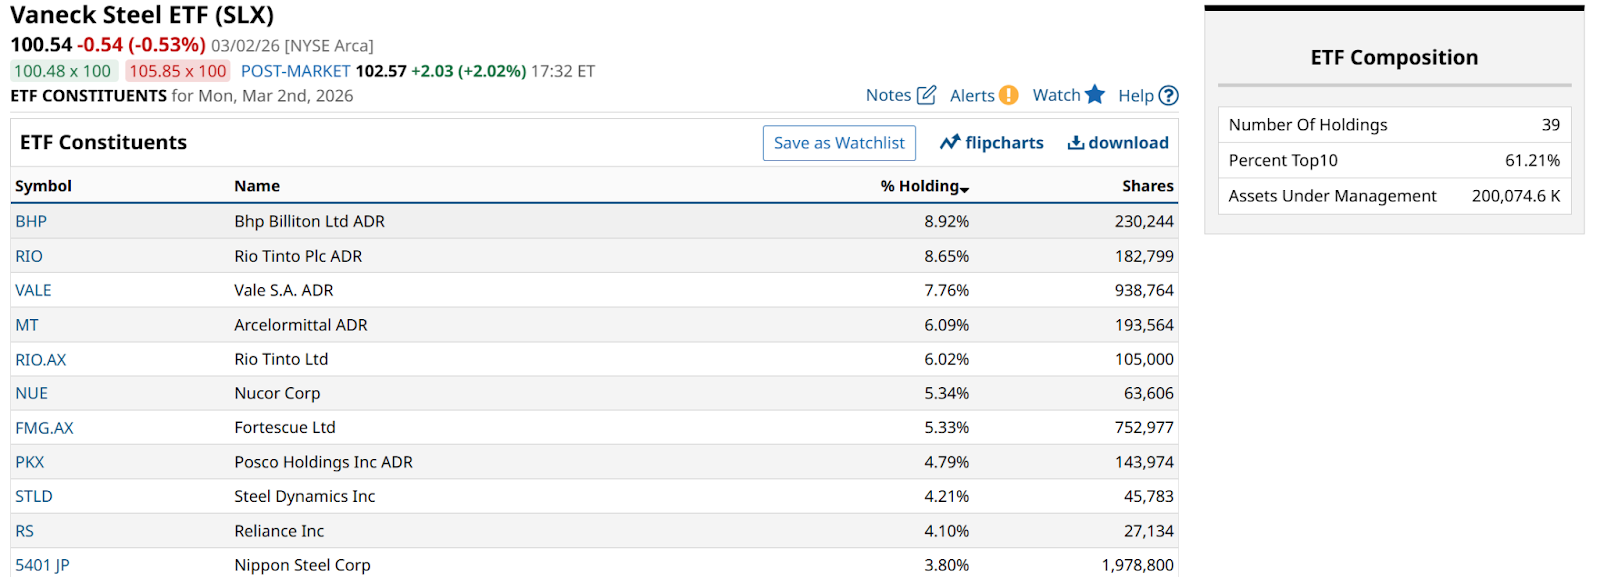
These days, I tend to track it via the VanEck Steel ETF (SLX). This industry tracker is approaching its 20th birthday. You can see the top holdings here, including Nippon Steel (NPSCY), which acquired US Steel, among the 39 stocks in SLX. It is concentrated as so many industry ETFs are, at more than 60% across its top 10 holdings. The fund is not huge, at $200 million. But it has been a potent performer at times.
SLX gives investors and traders a targeted look at the global steel industry by tracking a basket of companies involved in steel production, fabrication, and the mining of iron ore. The narrative for the steel sector is currently dominated by a structural shift toward infrastructure-led demand and the high-capital transition to green steel production.
The bull case for SLX is anchored by a significant rebound in global demand which is expected to grow modestly, by about 1%-3%, in 2026. This growth is being fueled by massive infrastructure projects in the U.S. and India, alongside a stabilization of manufacturing activity in Europe. The industry is also benefiting from a “green premium” of sorts, as environmental regulations drive demand for low-carbon steel produced in electric arc furnaces.
The bear case centers on the persistent weakness in the Chinese real estate sector and the resulting volatility in raw material prices. China remains the world’s largest steel producer and consumer, and its ongoing housing downturn continues to weigh on global iron ore sentiment. While Chinese production is expected to decline by roughly 4.5% in 2026 due to tighter environmental controls, the risk of excess Chinese steel being dumped on global markets remains a primary concern for Western producers.
Additionally, steelmaking remains a highly energy-intensive business. Any sudden spike in energy costs or a disruption in the supply of coking coal, could rapidly erode the profitability of the cyclical firms that dominate this ETF.
What Does the SLX Chart Say?
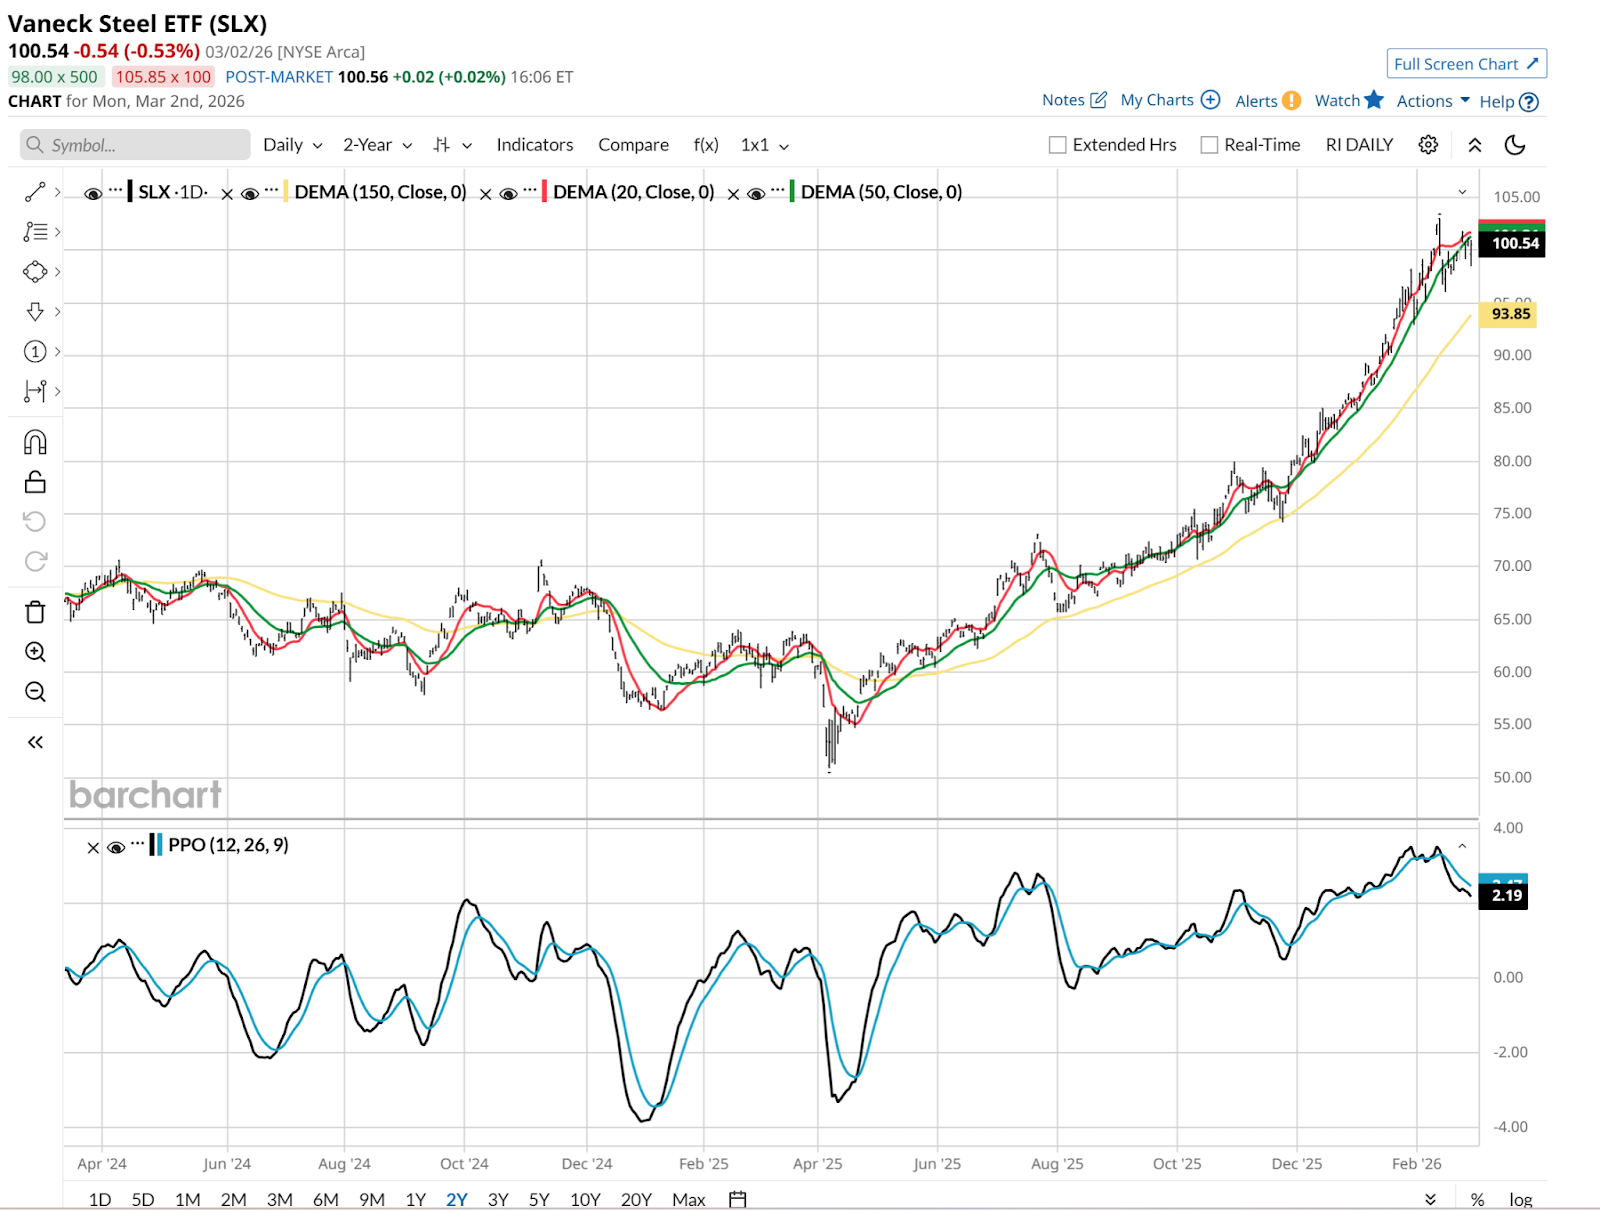
This is one stretched ETF price trend. And it does seem priced for a decline. The Percentage Price Oscillator (PPO) just crossed over from a very high level. And without using any fancy technician jargon, perhaps we can agree that when an entire industry doubles in under 12 months’ time as SLX just did, it is “rich” on that measure alone.
That said, the ROAR Score analysis I did on SLX indicates why we can’t simply count out an ETF or stock simply because it is way up in price. Shown below, the score as of Monday’s close was at 50. That’s neutral territory. Not an indication of extreme risk.
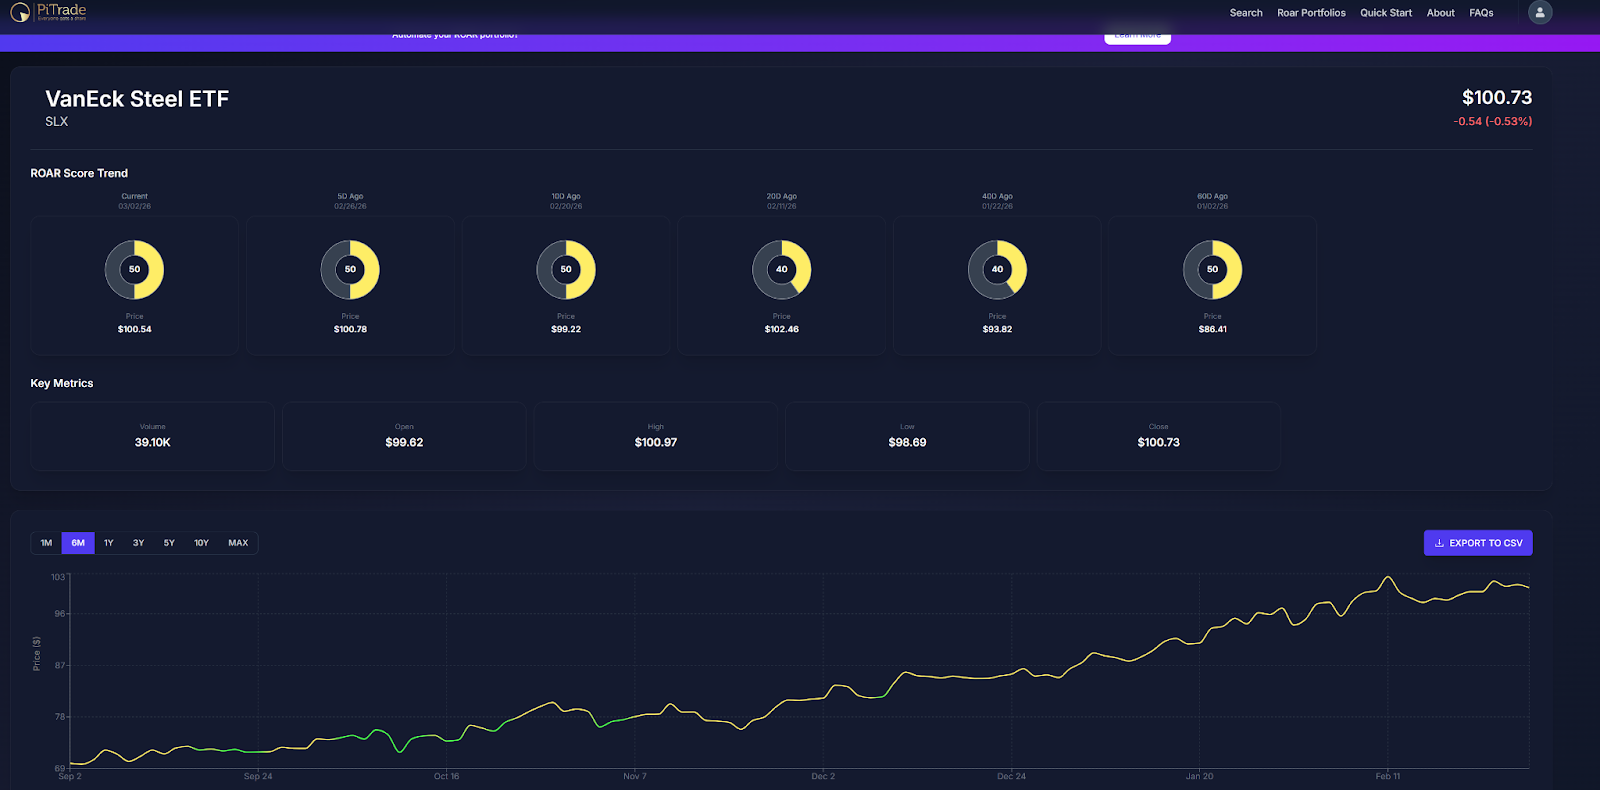
And as the lower part of the chart shows, covering the past 6 months, the ROAR score has not spent a single day in the red zone (high risk versus return potential). It helped investors and traders by flashing green back in September when SLX was in the low-$70 range and has been mostly in “maintenance” mode (yellow/neutral risk zone) since that time. And more than 40% higher in price on the ETF.
In the case of SLX, it helps to also step back and visualize its 5-year pattern. That’s shown here.
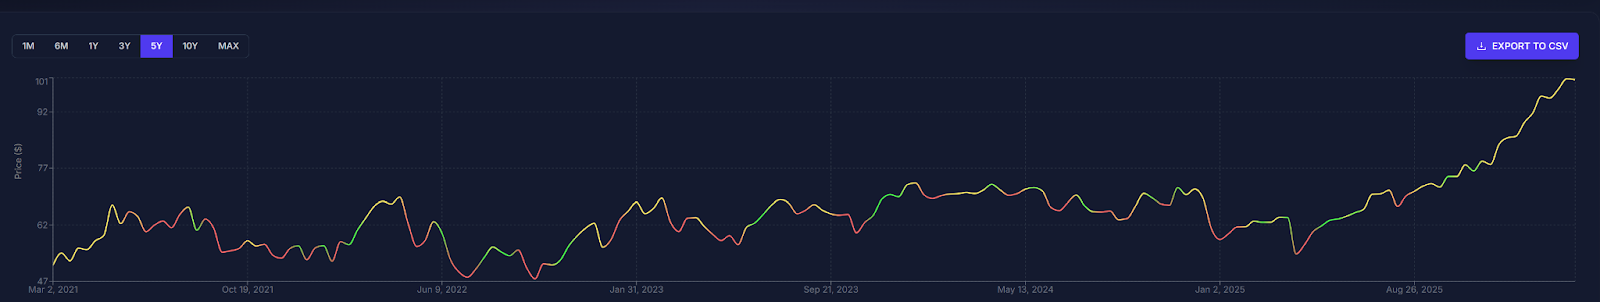
What do I see? A far more indecisive ETF price trend, throughout the 2021-2024 time frame. SLX traded in a wide range, from around $50-$70 a share through most of that time. And that is the point. Its ROAR Score was very skittish, which happens with volatile assets. But only more recently did it finally break out in a meaningful way.
What’s Next for SLX?
This is not what I’d consider a move to chase. But it has set new high ground for SLX. And that means a pullback of magnitude, followed by a consolidation period, could set this ETF up for another monster move higher. Patience is required, but at least it has shown us that as the industry has a chance at a long-delayed recovery, this basket of steel stocks might again be a source of returns.
Rob Isbitts created the ROAR Score, based on his 40+ years of technical analysis experience. ROAR helps DIY investors manage risk and create their own portfolios. For Rob's written research, check out ETFYourself.com.
On the date of publication, Rob Isbitts did not have (either directly or indirectly) positions in any of the securities mentioned in this article. All information and data in this article is solely for informational purposes. For more information please view the Barchart Disclosure Policy here.
More news from Barchart
- Steel Stocks Have Been Flying Higher. The Chart Says Another Monster Move Could Be Coming.
- This Formerly Hot Social Media ETF Is Getting More Anti-Social by the Day
- Before Trump Goes to China, Don’t Miss a Rare Buying Opportunity in This 1 ETF
- Financial Stock ETFs Look Downright Dangerous. How To Manage the Risk.