Typically, I write this column on Saturday morning, but an unusual heat wave in my neck of the woods pushed things to the evening. Regardless of the clock, the market has undergone massive changes that are worth exploring.
As a consistent observer of unusual options activity, I know this screener—and the aberrant transactions it reveals—is where the most actionable inferences are perceived to live. For example, if a huge volume of call options enters the frame, many assume that the security could move higher.
While that could be true, unusual options screeners inherently carry ambiguities that require expert knowledge and analysis to properly interpret. Even then, the ambiguity problem doesn’t quite go away because without a direct link to a ledger of intentions, it’s difficult to know for sure what the option was tied to (if anything).
On the other hand, volatility skew is a different animal. Definitionally speaking, volatility skew reflects the aggregate pricing pressure across the entire (selected) options surface. In other words, the skew shows how the market is structuring risk — not just where one trade printed.
Of course, unusual options activity can provide color or context for a particular argument, which is why analysts often cite it to support their case. However, it’s a challenge just to make an argument solely from unusual options. By contrast, volatility skew essentially takes all the most significant options trade and provides a visual representation of where the smart money believes most of the target security’s risk is concentrated.
Below are two devastated “stocks to sell” where the volatility skew suggests a contrarian opportunity may be lurking.
Sunrun (RUN)
Speaking of heat waves, let’s talk about Sunrun (RUN). The residential solar energy company got obliterated last week following its fourth-quarter earnings report, with a weak outlook leading to a cratering in market value. On Friday, RUN stock lost more than 35%. Still, the smart money doesn’t seem particularly worried.
Looking at volatility skew for the April 17 expiration date, implied volatility (IV) for both calls and puts near the spot price is relatively flat, reflecting no real urgency. Toward the left-hand side (and thus toward lower strike prices), the skew remains level, which I deem to be information by omission. If options traders were panicked — and remember, these folks generally represent the more sophisticated and well-resourced group — you’d expect heightened demand for protective puts.
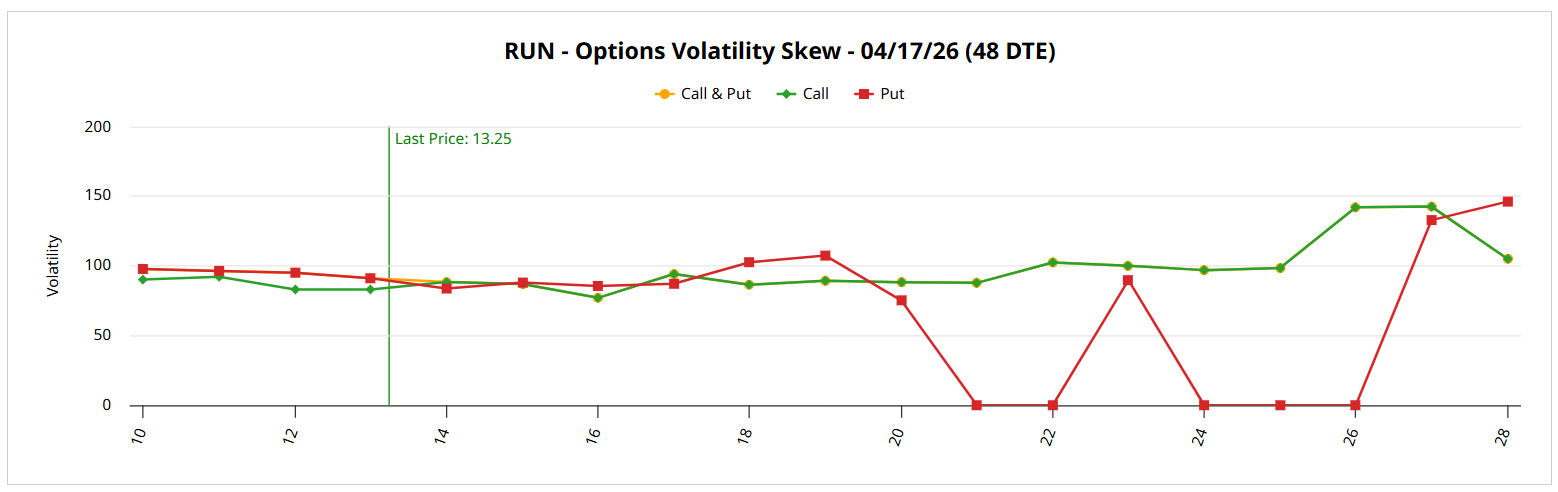
Instead, the skew on the right side (toward higher strikes) is witnessing positioning for upside convexity; that is, options traders see greater risk in RUN stock reflexively swinging higher than they do in RUN continuing to sustain losses.
With the Expected Move calculator pointing to an upper price target of $16.06 for the April 17 expiration date, I’m tempted by the 14/15 bull call spread expiring on the aforementioned date. For a net debit of $40, traders are aiming for RUN stock to rise through the $15 strike at expiration. Doing so would lead to a profit of $50, a payout of 150%.
Duolingo (DUOL)
Learning a foreign language is a powerful and enriching experience, but Wall Street still needs to see viability in the bottom line — and apparently, Duolingo (DUOL) doesn’t really make the cut. Another name that got absolutely cooked, DUOL stock tumbled following the language-learning app’s Q4 earnings report. Ignominiously, the security received a rating of 100% Strong Sell by the Barchart Technical Opinion indicator.
Is it time to panic? The smart money seems to have a much different idea. Near the spot price, the volatility skew for the April 17 expiration date indicates no unusual urgency to hedge against risk. As with Sunrun, what really stands out for DUOL stock is the skew on the left-hand boundaries, which remains relatively level. Instead, the skew swings higher on the right side in a controlled manner.
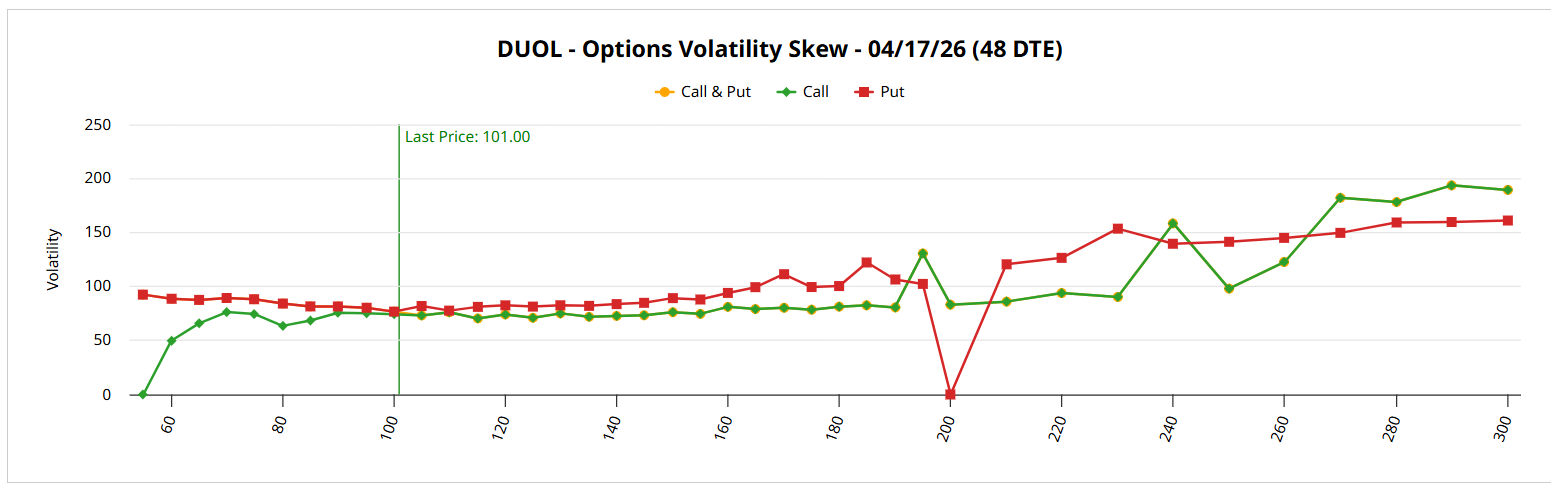
No matter the framing, it’s difficult to say that options traders are excitedly signaling for one direction or another. Nevertheless, the main prioritization here is upside convexity: the smart money likely sees a greater risk in not catching a possible upside swing rather than protecting against a sustained downturn.
This contrarianism also makes sense because DUOL stock has a very high short interest of 22.01% of its float, per Fintel. In other words, Duolingo may be a short-squeeze candidate.
For those who want to take a measured bet, the 100/110 bull call spread expiring April 17 may be intriguing. The Expected Move calculator calls for an upper price target of $119.62, which makes the $110 potentially conservative.
On the date of publication, Josh Enomoto did not have (either directly or indirectly) positions in any of the securities mentioned in this article. All information and data in this article is solely for informational purposes. For more information please view the Barchart Disclosure Policy here.
More news from Barchart