Nvidia’s (NVDA) fourth-quarter earnings report, released Wednesday after market close, leaves the software sector at a critical crossroads. While Nvidia, the largest company on the planet by market capitalization, has once again demonstrated its dominance in AI infrastructure, the iShares Expanded Tech-Software Sector ETF (IGV) continues to struggle.
The narrative for IGV has shifted from high-growth enthusiasm to high-risk, high-return. Akin to a gamble on whether AI will ultimately enhance or cannibalize traditional software models. Analysts have even considered the potential for some software names to go to zero. This is indeed a dark and strange time for the industry. And since it is a subsection of the vaulted technology sector, IGV’s fate is tied to the broader market more than most industry ETFs.
Markets are increasingly wary that agentic AI and automated coding tools, like Anthropic's Claude Cowork are eroding the moats of established Software-as-a-Service (SaaS) players. They call it the “SaaSpocalypse.” It is the fear that as software becomes cheaper and faster to build, the high-fee subscription models of incumbents may face severe pricing pressure. Software is living in the world of a 1990s travel agent, so to speak.
However, this has been a forgiving market, and for a very long time. For those looking for a high-octane turnaround from here forward, the current drawdown has pushed IGV near key technical support levels not seen since the spring of 2025. There is a strong case for steep undervaluation here. The death of tech has been greatly exaggerated before.
IGV is not just an industry ETF. It is headed by some very prominent, vital names that have helped create the tech bubble. So if that’s to continue, IGV can’t be left behind.
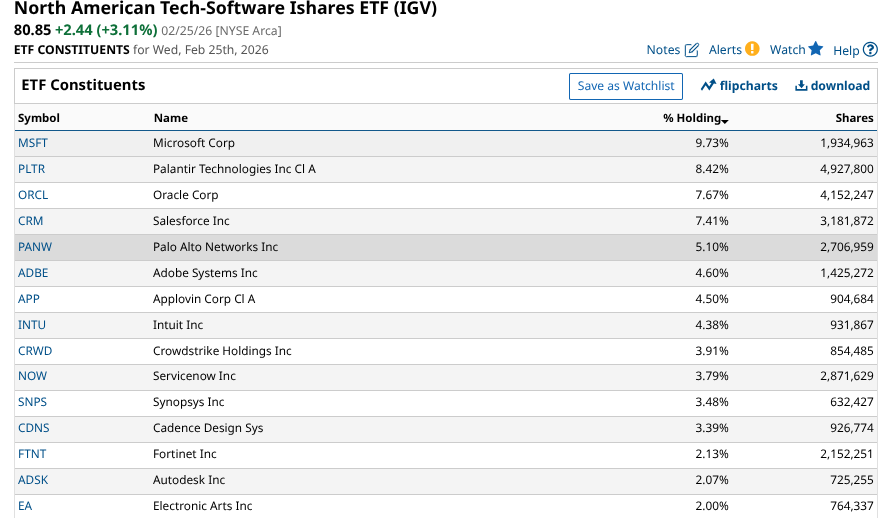
There are well over 100 stocks in this ETF, as it spans the cap size range, well beyond the big, iconic software stocks. However, only 10 of them account for nearly 60% of assets. So as they go, so goes IGV. And perhaps the tech sector as well.
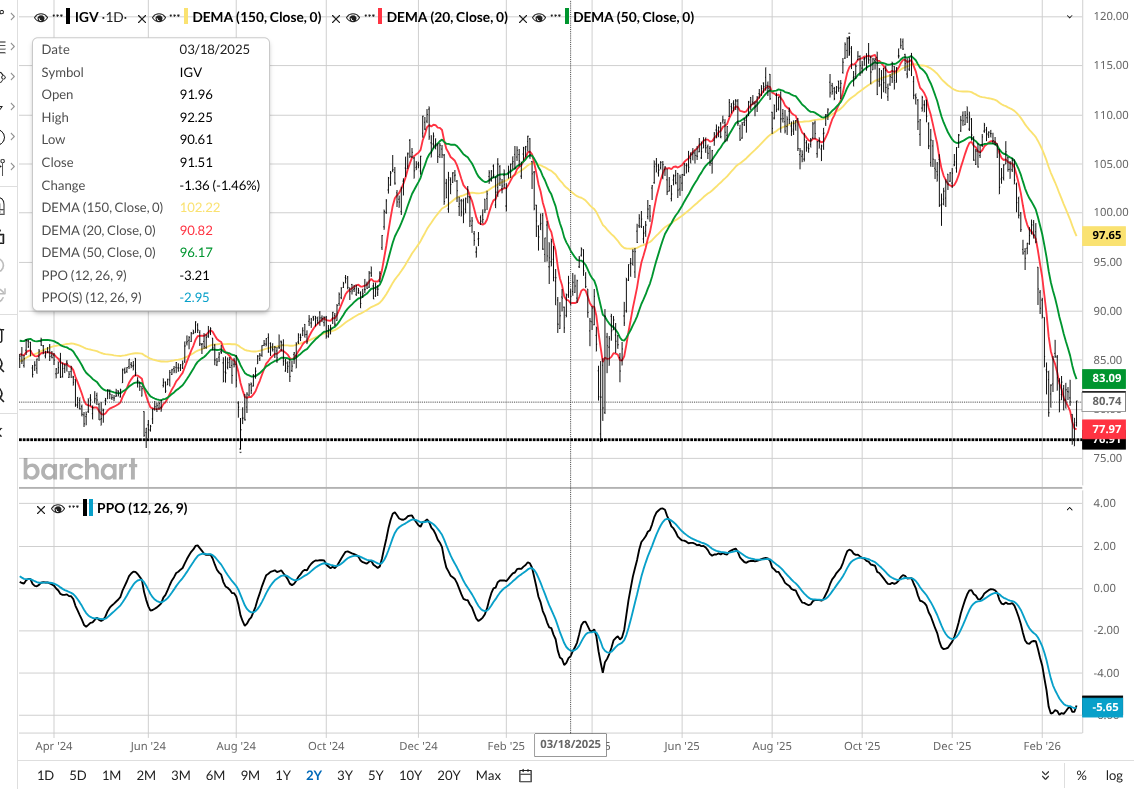
That chart above, a daily view, is like high risk and high reward personified to me. I do not see many charts that look like this. It is intriguing enough for the fact it recently landed in an area that it has touched 4 times in the past 2 years. But it's the Percentage Price Oscillator (PPO) indicator at the bottom which has me both skeptical and curious to see what happens.
The PPO is flat and apparently directionless for now. That’s to be expected in a market still trying to grapple with a new reality for the software business.
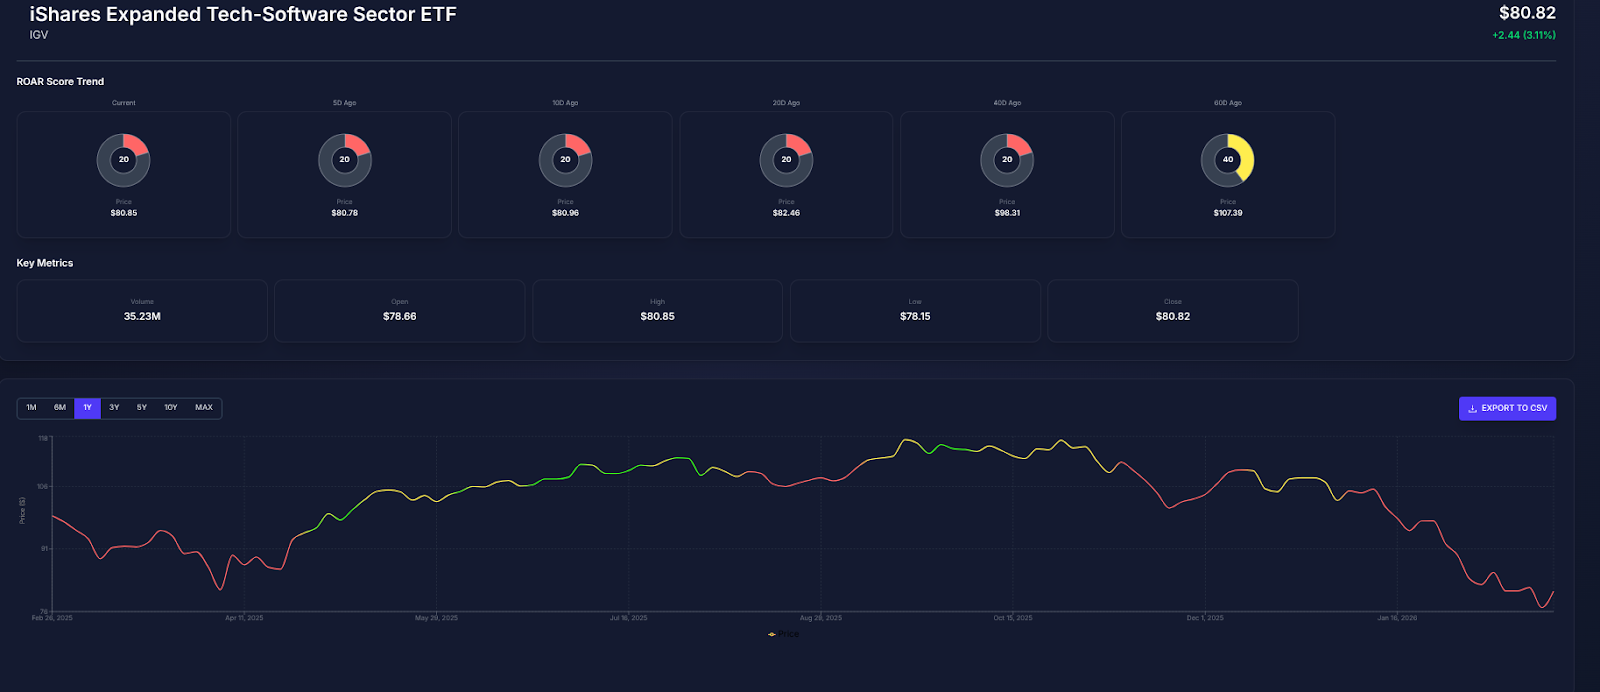
Wednesday’s bounce was a relief for IGV holders. But the ROAR analysis above indicates 2 things to me.
First, the odds still favor more downside. But there’s at least a fighting chance. While a score of 20 implies that it’s about a 4:1 ratio of downside to upside from here, that is sometimes the point at which an ETF or stock can bottom out. However, that typically takes a catalyst. There is not an obvious one in sight.
The other feature of this analysis that I find significant is that ROAR has been in the red (high risk) zone since Nov. 10, a period of 3.5 months. During that time, IGV has plunged from $112 to $81.
But importantly, the PPO had just crossed into negative territory back in early November. So the glass half full crowd can at least argue that this time around, the low ROAR Score could be a sign of a washout, instead of yet another “sell the quick rally” situation.
This is a tossup, obviously. There are too many emotional factors at work to try to perform traditional analysis that will land firmly to one side. But that’s what risk management is really about. Separating “high percentage shots” from volatile bets. IGV is still in the latter category.
Rob Isbitts created the ROAR Score, based on his 40+ years of technical analysis experience. ROAR helps DIY investors manage risk and create their own portfolios. For Rob's written research, check out ETFYourself.com.
On the date of publication, Rob Isbitts did not have (either directly or indirectly) positions in any of the securities mentioned in this article. All information and data in this article is solely for informational purposes. For more information please view the Barchart Disclosure Policy here.
More news from Barchart