
I asked if wheat prices can recover in a November 28, 2025, Barchart article. I concluded the article with the following:
If wheat prices decline towards $5 per bushel, they could offer significant value as the downside risk is far less than the upside potential for the agricultural product that is the primary ingredient in bread and other products that feed the world. Wheat prices can continue to recover, but weather conditions and inventory levels will be crucial in 2026.
Don’t Miss a Day: From crude oil to coffee, sign up free for Barchart’s best-in-class commodity analysis.
Nearby CBOT wheat futures were trading at $5.29 per bushel on November 26, 2025. At over the $5.65 level in late February 2026, prices are higher.
CBOT wheat futures have a bullish bias
Nearby CBOT soft red winter wheat futures bottomed after hitting a low of $4.9225 per bushel in October 2025.
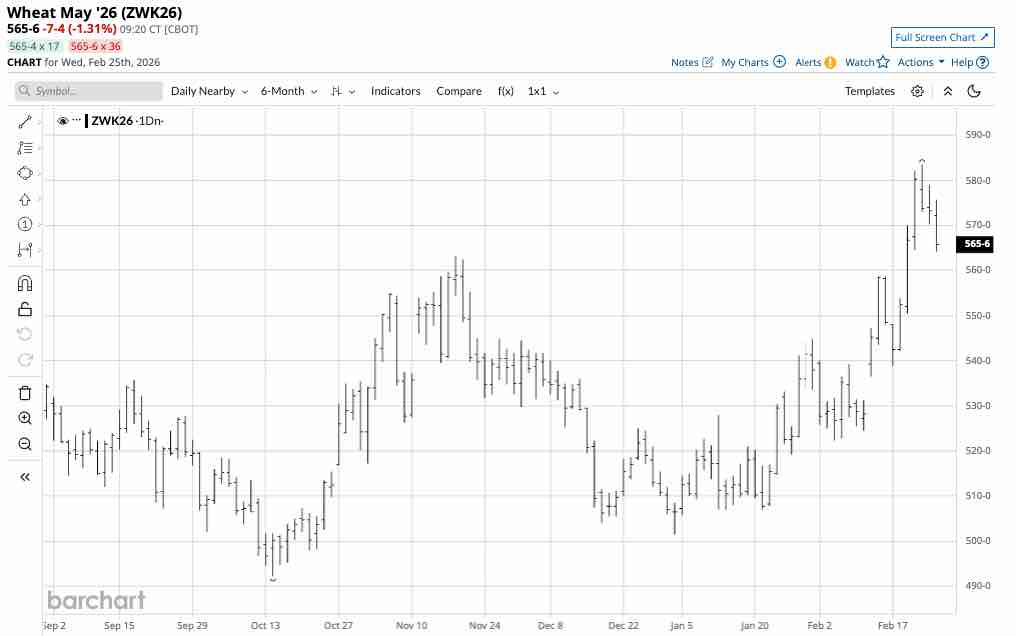
The daily continuous futures contract chart shows that the nearby CBOT wheat futures have formed higher lows and higher highs since mid-October 2025, rising 18.5% to a recent high of $5.8350 per bushel on February 23, 2026.
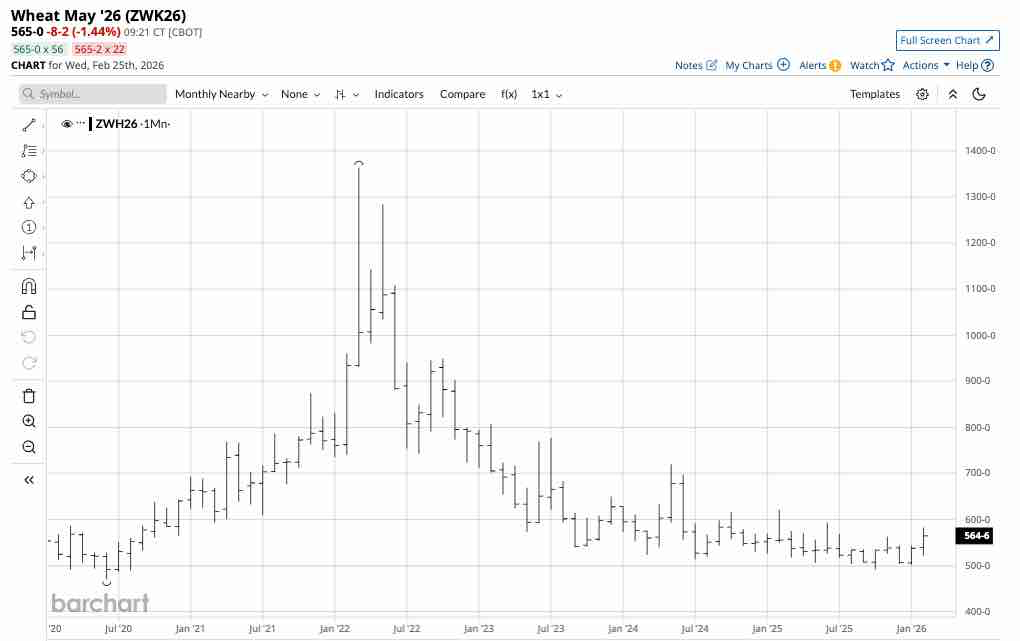
The monthly continuous contract chart shows that CBOT wheat futures moved above the November 2025 high of $5.6325, within striking distance of the June 2025 high of $5.94 per bushel, and remained in a bullish recovery trend.
The February WASDE- A Mixed Picture for Wheat Fundamentals
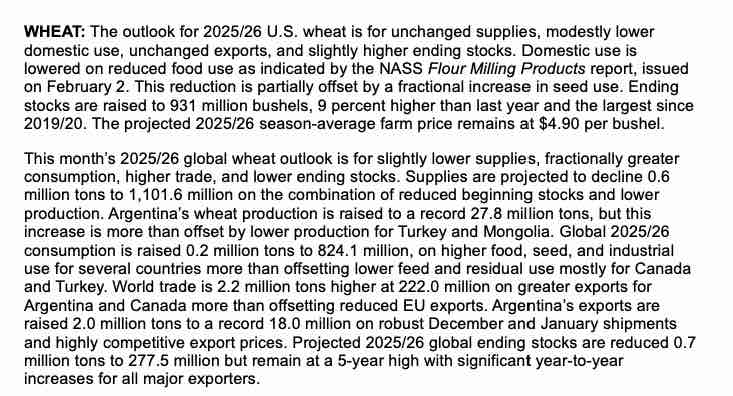
The U.S. Department of Agriculture released its latest February World Agricultural Supply and Demand Estimates Report before the start of the 2026 Northern Hemisphere crop year on February 10, 2026. The WASDE Report told the wheat market:
The WASDE report was a mixed bag for the wheat market as it said that U.S. stocks rose and global wheat inventories fell from the previous report. The WASDE left its soybean price forecast unchanged at $4.90 per bushel, which is nearly $1.00 below the current May 2026 futures price.
I reached out to Jake Hanley, the Chief Growth Officer and Director of Investments at the Teucrium family of agricultural ETF products. Jake told me:
This month’s report solidified the bearish sentiment hanging over the wheat market. Domestic ending stocks were increased to 931 million bushels, coming in above the average analyst estimate and marking the largest U.S. wheat supply since the 2019/20 season. The build resulted from lower domestic food use estimates. The U.S. stocks-to-use ratio increased to a burdensome 45.9%, a six-year high that should continue to act as a significant headwind for domestic prices.
The global balance sheet is less heavy but remains well-supplied. While world ending stocks were trimmed slightly to 277.5 million metric tons, they remain at a five-year high, keeping the global stocks-to-use ratio at an adequate 33.7%. Record production in countries like Argentina is feeding strong global import demand, but it is not enough to meaningfully draw down ample global inventories. The overarching theme for wheat remains one of abundant supplies, which will likely cap any significant price rallies in the near term.
Wheat supplies remain abundant, but the weather and potential impact of the ongoing war in Ukraine could affect wheat prices over the coming weeks and months.
The weather, Russia, and Ukraine are critical factors for the price
The great uncertainty in each new crop year is always weather conditions across the leading growing areas during the planting, growing, and harvest seasons. Wheat futures reached a bottom in October 2025 after the last crop year produced ample supplies to meet global demand. However, 2025 supplies do not guarantee that the weather over the coming months will produce another bumper crop.
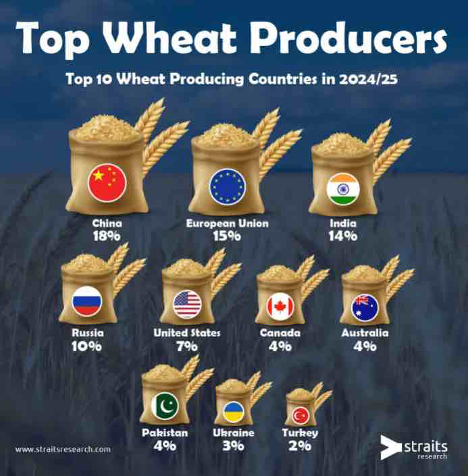
As the chart shows, Russia and Ukraine accounted for 13% of the world’s 2024/2025 wheat production. Therefore, any escalation of the ongoing war or events that impact logistics in the Black Sea, a critical export location, could cause volatility in global wheat prices, as the WASDE reduced global inventories that remain at a 5-year high, with “significant year-to-year increases for all major exporters.”
Levels to watch in wheat and the KCBT-CBOT Spread
The spread between KCBT hard red and CBOT soft red winter wheat futures can provide clues about consumer hedging in the U.S. wheat market. Many U.S. bread manufacturers price their requirements based on the KCBT wheat futures price, while the CBOT wheat futures are the global benchmark.
The long-term norm for the KCBT versus CBOT wheat spread is a 20-30-cent premium for KCBT wheat. When the premium for KCBT wheat rises, it can indicate that consumers are hedging their requirements. When it the premium falls, it is often a sign of hand-to-mouth consumption due to depressed prices.
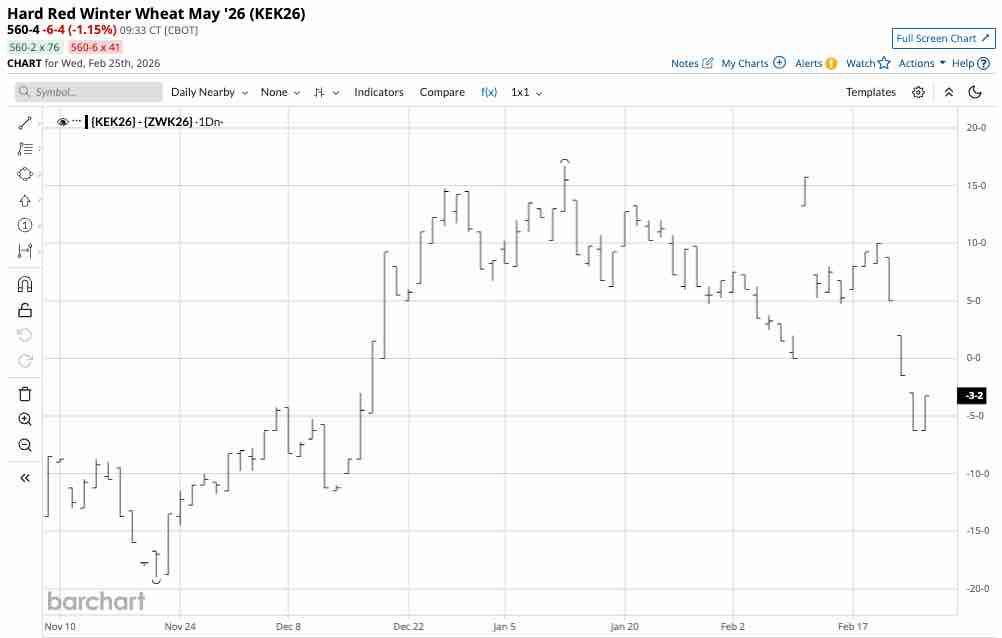
As the continuous spread chart shows, the KCBT wheat futures dropped to nearly a 20-cent per bushel discount to CBOT wheat futures on November 20, 2025, indicating hand-to-mouth consumer buying. However, with the uncertainty of the 2026 crop year on the horizon, the spread had been rising and reached an over 16-cent premium for the hard red winter wheat on January 12, 2026. The rise in the spread toward the historical norm was a bullish sign for wheat prices, but it has declined back to a 3.5-cent discount for the KCBT wheat after the most recent rally.
WEAT is the ETF that tracks a portfolio of CBOT wheat futures prices
The trend is always a trader’s or investor’s best friend, and it has a bullish bias in the CBOT wheat futures market. The most direct route for a wheat risk position is the futures and futures options on the CME’s CBOT division. The Teucrium Wheat ETF (WEAT) provides an alternative to the futures and trades on NYSE Arca, available to all market participants with a standard equity account. At $21.56 per share, WEAT had assets under management of over $122.69 million. WEAT trades an average of over 291,000 shares daily and charges a 0.83% management fee. WEAT owns a portfolio of three actively traded CBOT wheat futures contracts, excluding the nearby contract, to mitigate futures roll risks. Since the most speculative activity occurs in the nearby contract, WEAT tends to underperform the nearby contract on the upside and outperform it during price corrections.
The continuous CBOT futures rallied 18.5% from the October 2025 low to the February 2026 high.
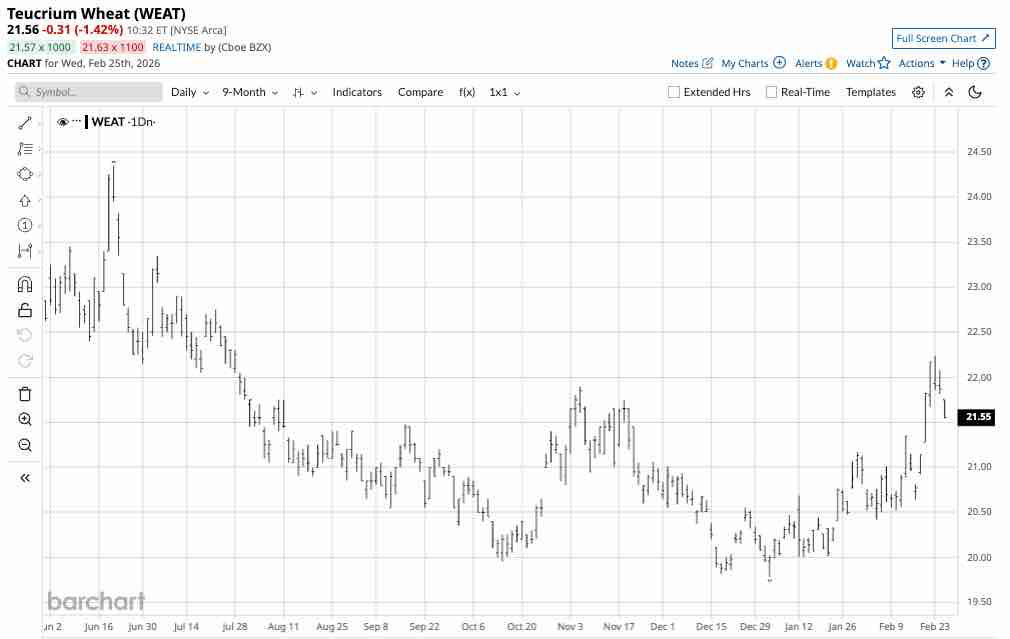
The daily chart shows that over the same period, the WEAT ETF rose 11.5% from $19.95 to $22.24 per share. WEAT underperformed the nearby contract on the upside and will likely outperform on the downside, on a percentage basis, if CBOT wheat prices decline from the current level.
One of the WEAT ETF’s drawbacks is that it trades only during U.S. stock market hours, so it can miss highs or lows when the market is closed. CBOT wheat futures have a bullish bias in late February 2026, but weather, production, and logistics from the Black Sea region will be critical factors in determining the path of least resistance for wheat prices over the coming weeks and months during the 2026 crop year.
On the date of publication, Andrew Hecht did not have (either directly or indirectly) positions in any of the securities mentioned in this article. All information and data in this article is solely for informational purposes. For more information please view the Barchart Disclosure Policy here.
More news from Barchart


