
Taiwan Semiconductor (TSM) cuts a distinct profile within the technology and artificial-intelligence-based ecosystem, with the security continuing to sustain its dominant run from prior years. Not only is TSM stock up nearly 22% on a year-to-date basis, it has also earned a 100% Strong Buy rating from the Barchart Technical Opinion indicator. There’s seemingly no stopping this freight train, in part because of where it sits in the production chain.
Unlike the frontline semiconductor companies, Taiwan Semiconductor — better known as TSMC — is a foundry. Significantly, this status means that it doesn’t compete with other finished products. Rather, when AI demand rises, other chip designers contract TSMC to build their chipsets. By sitting upstream in the production line, the company does the equivalent of selling tickets to the big game rather than betting on which team will win the matchup.
In other words, TSMC rises on the front-loaded macro picture of AI. So long as people desire machine learning — and this incentive isn’t going anywhere — TSM stock will likely benefit.
Even in the specific details, the foundry stands on compelling ground. For example, on a cumulative basis, options flow — which focuses exclusively on big block transactions likely placed by institutional investors — in February has been overwhelmingly bullish. Not only that, some of the most optimistic sessions (such as the Feb. 12 session) feature debit-based calls.
These derivatives typically feature far out-the-money (OTM) strike prices, which means that TSM stock must rise to meet specific profitability thresholds. That’s a much stronger signal than credit-based options, which may hide neutrality in their intent.
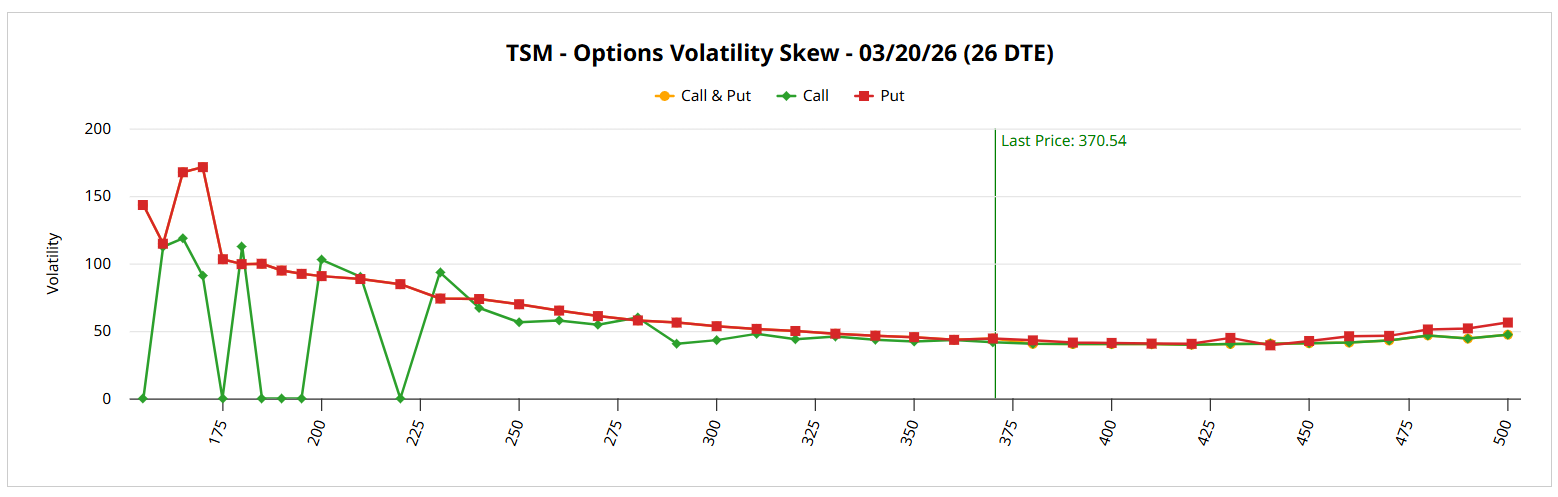
Another intriguing factor to consider is volatility skew. Definitionally, the skew is a distortion of the volatility surface area. Under a condition of no sentiment or structural bias, this indicator would be perfectly flat across the strike price spectrum. However, as smart money traders buy “insurance” against either downside or upside risk, the skew becomes distorted, allowing retail traders to read the sentiment profile of sophisticated market participants.
In the case of TSM stock for the March 20 expiration date, the skew is only modestly elevated to protect against downside tail risk. As such, on a volatility basis, TSM calls could be relatively cheap.
Establishing the Trading Parameters of TSM Stock
Undergirding the volatility skew is a statistic known as implied volatility (IV). As the name suggests, IV is an estimation of where a target security may travel. This too is a critical piece of information, as IV represents a residual value that stems from actual order flows. That’s important because we’re not talking about random, handwaved figures.
With the skew, we can understand what the smart money perceives to be the direction that carries unusual risk. In some situations, it’s not unusual to see the skew be elevated on opposite boundaries, meaning that traders are pricing in for the possibility of both upside and downside convexity. What we don’t know, however, is how the order flows in the system may translate to actual price outcomes.
That’s where the Expected Move calculator comes into the picture.
Based on the Black-Scholes formula, the Expected Move integrates volatility and days to expiration into a mathematical algorithm, spitting out a price envelope or dispersion for a given options chain. Essentially, the assertion is that in 68% of cases, the target security will likely fall somewhere between the defined parameters.
Regarding the March 20 expiration date, Expected Move anticipates that TSM stock will trade between $341.17 and $399.91. While we now have a realistic range of where TSM may land, we still need additional data to narrow down a debit-based strategy.
Yes, it is possible to buy (or sell) a condor-like strategy. However, in the case of a long iron condor, buying a bullish debit and a bearish debit can be cost prohibitive in the long run, especially if some of these trades don’t end up working out — and no strategy works 100% of the time.
One mechanism to narrow down the possibilities is Barchart’s Seasonal Returns heatmap.
Narrowing the Probability Space
As the website points out, the Seasonal Returns chart highlights recurring trends in asset performance over specific months of the year, offering insights into potential price movements. We find that March represents one of the more solid-performing months of the year for TSM stock.
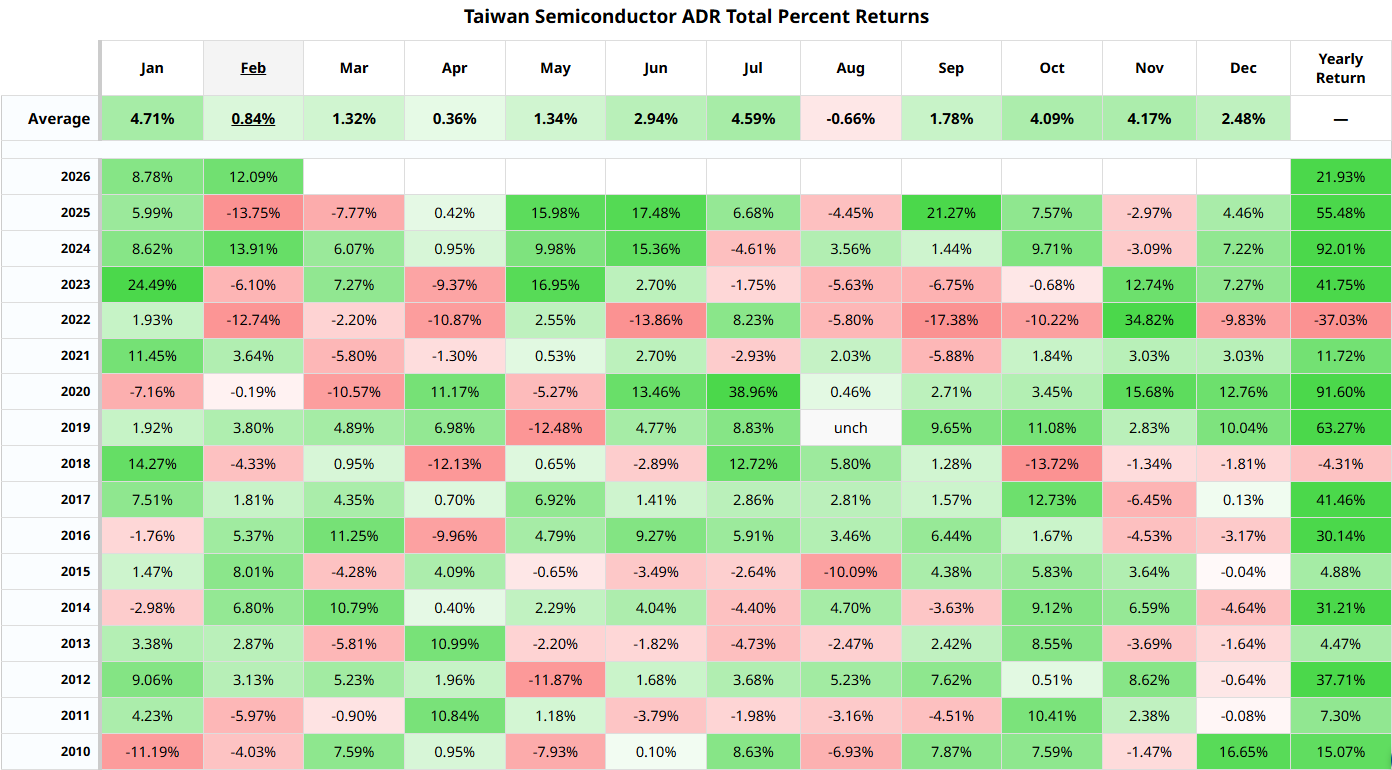
What’s enticing is that, when March returns are positive, TSM on average tends to rise 6.49% (using data since 2010). If that’s the case, I’m going to be really tempted by the 380/390 bull call spread expiring March 20.
This wager requires a net debit of $455. If TSM stock rises through the $390 strike (about 5.3% above Friday’s close), the maximum profit would be $545 or a payout of nearly 120%. Breakeven lands at $384.55, helping to improve the trade’s probabilistic credibility.
On the date of publication, Josh Enomoto did not have (either directly or indirectly) positions in any of the securities mentioned in this article. All information and data in this article is solely for informational purposes. For more information please view the Barchart Disclosure Policy here.
More news from Barchart
- Taiwan Semi Stock Is Soaring Above AI Bubble Fears. Where Options Data Says It Is Headed Next.
- How to Optimize Your Option Screener Results for Put Selling Strategies
- Domino's Pizza Hikes Its Dividend By 14.3% After Free Cash Flow Rises 29% - Value Buyers Love DPZ Stock
- $350+ Nvidia Stock Price Target? This Options Strategy Pays You No Matter What Happens Next.


