
VANCOUVER, BC / ACCESSWIRE / February 26, 2024 / Faraday Copper Corp. ("Faraday" or the "Company") (TSX:FDY)(OTCQX:CPPKF) is pleased to announce the results of its metallurgical program at its Copper Creek project in Arizona, USA ("Copper Creek").
Paul Harbidge, President and CEO, commented "The positive results from our metallurgical program continue to support our work towards advancing the Copper Creek project by significantly improving the economic returns and future metal production profile. In addition, the Phase III drill program is underway with a focus on testing new targets and expanding the Mineral Resource. I am excited about the exploration upside, especially with the initial reconnaissance drill results from the Area 51 target, which identified a new near-surface mineralized breccia."
Metallurgical Program Highlights
The metallurgical program was designed to evaluate grind size optimization, gold recoveries, and test additional samples from the near-surface mineralization to further enhance project economics compared to the Preliminary Economic Assessment 1 ("PEA"). Key highlights include:
-
Achieved copper rougher 2 recoveries of 95% in the sulphide composite by applying a substantially larger grind size 3. The increased grind size confirms the following benefits:
- Opportunity to increase copper rougher recoveries to over 97% by utilizing Coarse Particle Flotation ("CPF") scavenging. CPF supports a potential increase to mill throughput without increasing the tailings pressure filtration requirement;
- Significant reduction in ball mill grinding energy compared to the PEA (approximately 50%); and
- Maintained copper concentrate quality with a consistently high average concentrate grade of 30.5% copper.
- Confirmed gold recoveries in copper concentrate of over 75% supporting the potential for payable gold in the copper concentrate, which was not considered in previous studies.
- Significantly improved near-surface oxide recovery through column leach tests, which returned copper recoveries of 84% to 92% in 43 days with net acid consumption <12 kg/t, compared to 75% in 60 days with net acid consumption of 20 kg/t utilized in the PEA.
Zach Allwright, VP Projects and Evaluations, stated "The metallurgical program has uncovered significant upside, indicating that mill throughput in future technical studies could increase substantially from the PEA base case, while maintaining or enhancing metal recoveries. In addition, the test work highlights the opportunity to reduce operating costs and supports the potential for payable gold in the copper concentrate. Importantly, the Company's strategy of minimizing water consumption and limiting the surface footprint is supported by these favorable processing characteristics. We look forward to further increasing the value of the Copper Creek project."
Next Steps
Based on the outcomes of the metallurgical program and ongoing exploration results, the Company is targeting the following steps to continue to enhance the value of the project:
- Exploration Drilling: Phase III drilling continues and is focused on reconnaissance drilling on new targets, expanding the Mineral Resource and better delineating high-grade mineralized zones.
- Gold Assay Program: The Company continues to advance the gold assay program, currently focused on the Keel underground zone. Assay results from this program, paired with existing gold data, could support the inclusion of gold in future resource updates and project economics.
- Metallurgical Assessments: Test work will be conducted as new resource targets are delineated. In addition, continued assessments will include further CPF flowsheet evaluation and a material type characterization program.
- Technical Report Update: To incorporate updated geological, geotechnical, economic and metallurgical datasets.
For an overview of the metallurgical program and additional technical details, refer to the Appendix at the end of this news release.
Qualified Person
The scientific and technical information contained in this news release has been reviewed and approved by Faraday's Vice President, Projects and Evaluations, Zach Allwright, P.Eng., who is considered a Qualified Person under National Instrument 43-101 - Standards of Disclosure for Mineral Projects ("NI 43-101").
The information in this report relating to metallurgical test work results is based on and fairly reflects information reviewed by Mr. Peter Mehrfert, P.Eng. (Ausenco Engineering's consultant to Faraday). Mr. Mehrfert is a qualified metallurgist and has sufficient experience which is relevant to the management and interpretation of test work activities undertaken to qualify as Competent Person under NI 43-101. Mr. Mehrfert consents to the inclusion in the release of the matters based on their information in the form and context in which it appears.
About Faraday Copper
Faraday Copper is a Canadian exploration company focused on advancing its flagship copper project in Arizona, U.S. The Copper Creek project, is one of the largest undeveloped copper projects in North America with open pit and bulk underground mining potential. The Company is well-funded to deliver on its key milestones and benefits from a management team and board of directors with senior mining company experience and expertise. Faraday trades on the TSX under the symbol "FDY".
For additional information please contact:
Stacey Pavlova, CFA
Vice President, Investor Relations & Communications
Faraday Copper Corp.
E-mail: info@faradaycopper.com
Website: www.faradaycopper.com
To receive news releases by e-mail, please register using the Faraday website at www.faradaycopper.com.
Cautionary Note on Forward-Looking Statements
Some of the statements in this news release, other than statements of historical fact, are "forward-looking statements" and are based on the opinions and estimates of management as of the date such statements are made and are necessarily based on estimates and assumptions that are inherently subject to known and unknown risks, uncertainties and other factors that may cause actual results, level of activity, performance or achievements of Faraday to be materially different from those expressed or implied by such forward-looking statements. Such forward-looking statements and forward-looking information specifically include, but are not limited to, statements concerning the potential increase to copper recoveries and mill throughput, the expected copper concentrate quality, the potential for reduction in ball mill grinding energy, the expected gold and copper recoveries, the possibility of adding gold in future Mineral Resource Estimates and studies, the potential to reduce expected processing operating costs, and the exploration potential of the Copper Creek property.
Although Faraday believes the expectations expressed in such forward-looking statements are based on reasonable assumptions, such statements should not be in any way construed as guarantees of future performance and actual results or developments may differ materially. Accordingly, readers should not place undue reliance on forward-looking statements or information.
Factors that could cause actual results to differ materially from those in forward-looking statements include without limitation: market prices for metals; the conclusions of detailed feasibility and technical analyses; lower than expected grades and quantities of mineral resources; receipt of regulatory approval; receipt of shareholder approval; mining rates and recovery rates; significant capital requirements; price volatility in the spot and forward markets for commodities; fluctuations in rates of exchange; taxation; controls, regulations and political or economic developments in the countries in which Faraday does or may carry on business; the speculative nature of mineral exploration and development, competition; loss of key employees; rising costs of labour, supplies, fuel and equipment; actual results of current exploration or reclamation activities; accidents; labour disputes; defective title to mineral claims or property or contests over claims to mineral properties; unexpected delays and costs inherent to consulting and accommodating rights of Indigenous peoples and other groups; risks, uncertainties and unanticipated delays associated with obtaining and maintaining necessary licenses, permits and authorizations and complying with permitting requirements, including those associated with the Copper Creek property; and uncertainties with respect to any future acquisitions by Faraday. In addition, there are risks and hazards associated with the business of mineral exploration, development and mining, including environmental events and hazards, industrial accidents, unusual or unexpected formations, pressures, cave-ins, flooding and the risk of inadequate insurance or inability to obtain insurance to cover these risks as well as "Risk Factors" included in Faraday's disclosure documents filed on and available at www.sedarplus.ca.
This press release does not constitute an offer to sell or a solicitation of an offer to buy any securities in any jurisdiction to any person to whom it is unlawful to make such an offer or solicitation in such jurisdiction. This press release is not, and under no circumstances is to be construed as, a prospectus, an offering memorandum, an advertisement or a public offering of securities in Faraday in Canada, the United States or any other jurisdiction. No securities commission or similar authority in Canada or in the United States has reviewed or in any way passed upon this press release, and any representation to the contrary is an offence.
APPENDIX: OVERVIEW OF METALLURGICAL PROGRAM AND ADDITIONAL TECHNICAL DETAILS
Metallurgical Program Overview
The metallurgical program utilized samples from the Phase I and II drilling, to complement previous test work as summarized in the PEA. The metallurgical program was conducted by ALS Metallurgy, Kamloops, with oversight by Ausenco Engineering.
This test work program was designed to complete the following scope using samples taken throughout the resource area, with primary focus (and targeted sample coverage) on the open pit mill feed material:
- SAG mill comminution and Bond Mill Work Index ("BMWi") testing completed on all samples.
- Mineralogical composition assessment on three oxide, three transition and nine sulphide variability samples.
- Detailed mineralogy particle mineral analysis ("PMA") completed on sulphide master composite and coarse fractions of CPF sulphide composite.
- Flotation testing on sulphide composites and both sulphide and transition variability samples.
- Hydrofloat testing on a CPF sulphide composite.
- Column leach tests and oxide bottle roll tests on oxide samples.
- Gold analyses on feed samples and test products.
The outcomes of the metallurgical test work will be assimilated with the historical test work to form the basis of the process design criteria for future technical study updates.
Sample Selection and Spatial Context
The metallurgical program comprised of 15 samples across the three material type domains, designed to complement historical sample coverage and ultimately result in an improved representation of the mine plan production profile envisaged in the PEA. While the focus of this program was on open pit materials, two underground samples were also included. Sample details are presented in Table 1.
Table 1: Metallurgical Sample Details
Material |
Met ID |
Area |
Domain |
Drill hole ID |
Depth (m) |
Cu |
Mo |
Ag |
Au |
|
from |
to |
% |
% |
g/t |
g/t |
|||||
Oxide |
MET23-01 |
White bear |
OP |
22-008 |
8 |
26 |
0.58 |
0.001 |
1.0 |
0.02 |
MET23-02 |
Copper Knight SE |
OP |
23-026 |
20 |
37 |
0.18 |
0.001 |
1.0 |
0.02 |
|
MET23-03 |
Hilltop |
OP |
23-021 |
8 |
23 |
0.24 |
<0.001 |
1.0 |
0.02 |
|
Transition |
MET23-04 |
Copper Knight |
OP |
22-016 |
61 |
70 |
0.67 |
0.001 |
1.3 |
0.01 |
MET23-05 |
Copper Prince |
OP |
22-018 |
107 |
124 |
0.83 |
0.009 |
1.2 |
0.02 |
|
MET23-06 |
Copper Giant |
OP |
22-015 |
8 |
14 |
2.01 |
0.008 |
3.4 |
0.26 |
|
Sulphide |
MET23-07 |
Copper Giant |
OP |
22-012 |
33 |
43 |
0.34 |
0.002 |
0.4 |
0.02 |
MET23-08 |
Copper Giant |
OP |
22-012 |
62 |
80 |
0.40 |
0.001 |
0.7 |
0.03 |
|
MET23-09 |
Childs Aldwinkle |
OP |
23-023 |
188 |
208 |
0.91 |
0.020 |
3.8 |
0.13 |
|
MET23-10 |
Childs Aldwinkle |
OP |
23-023 |
223 |
239 |
0.42 |
0.026 |
1.0 |
0.02 |
|
MET23-11 |
Keel |
UG |
23-024 |
751 |
765 |
0.47 |
0.003 |
3.5 |
0.07 |
|
MET23-12 |
Keel |
UG |
23-024 |
939 |
949 |
0.62 |
0.004 |
5.9 |
0.02 |
|
MET23-13 |
Pole |
OP |
23-032 |
75 |
91 |
0.59 |
<0.001 |
4.0 |
0.05 |
|
MET23-14 |
Bald |
OP |
23-037 |
222 |
232 |
0.48 |
0.001 |
1.8 |
0.02 |
|
MET23-15 |
Mammoth |
OP |
22-008 |
493 |
507 |
0.79 |
0.001 |
1.0 |
<0.01 |
|
Note: Open pit domain is referenced as "OP" and underground domain is referenced as "UG".
Comminution Results
SAG and ball mill energy assessment tests were conducted on the variability samples, which included industry standard SAG mill comminution and BMWi measurements, respectively. Grind sizes stated herein refer to 80% passing ("P80") the specified particle size. Results are presented in Table 2.
Table 2: Comminution Results
Material |
A x b |
BMWi (kwh/t) |
||
Min / Max |
Average |
Min / Max |
Average |
|
Oxide |
32 / 59 |
45 |
- |
- |
Transition |
41 / 49 |
45 |
9.9 / 12.0 |
10.9 |
Sulphide |
30 / 42 |
37 |
12.3 / 14.3 |
13.3 |
The outcomes of the comminution test work are confirmatory of the PEA design basis and are within the design tolerances. BMWi results are marginally lower than the averages measured in the previous program.
Increasing the primary grind size to 220 µm could result in approximately a 13% reduction in ball mill grinding energy compared to the PEA estimate. Further increasing the grind size to 350 µm could result in a 50% reduction in ball mill grinding energy. Ball mill grinding energy was estimated in the PEA to account for roughly 24% of the total consumed power in the concentrator.
Flotation Performance - Sulphide Material
Flotation testing on the sulphide master composite culminated in a locked cycle test conducted at a primary grind size of 210 µm. It was determined that low dosages of potassium amyl xanthate ("PAX"), a less expensive and non-selective collector compared to what was considered in the PEA, was suitable for cleaner performance and improved recovery. Results are presented in Table 3.
Table 3: Locked Cycle Test Results
Sample |
Primary Grind (µm) |
Regrind (µm) |
Feed Assay (%) |
Concentrate Grade (%) |
Recovery (%) |
|||
Cu |
Mo |
Cu |
Mo |
Cu |
Mo |
|||
Sulphide Master |
210 |
33 |
0.56 |
0.007 |
31.2 |
0.33 |
94.2 |
85.2 |
Grind series testing suggested that coarser primary grinds compared to the PEA (190 µm) can be applied. More aggressive primary grind sizes were evaluated on the CPF sulphide composite and the variability samples. Test work confirms that targeting 350 µm resulted in only marginally lower copper recoveries. Rougher circuit copper recoveries were consistently high at the grind sizes tested. Results are presented in Table 4.
Table 4: Sulphide Rougher Flotation Results
| Sample ID | Primary Grind (µm) |
Rougher Mass (%) |
Feed (%) |
Rougher Recovery (%) |
||
Cu |
Mo |
Cu |
Mo |
|||
| MET23-07 | 420 |
6.1 |
0.33 |
0.002 |
80.7 |
53.9 |
| MET23-08 | 343 |
5.1 |
0.43 |
0.001 |
95.1 |
54.7 |
| MET23-09 | 319 |
9.3 |
0.95 |
0.016 |
96.5 |
94.5 |
| MET23-10 | 276 |
8.4 |
0.42 |
0.023 |
97.4 |
96.0 |
| MET23-11 | 278 |
5.5 |
0.43 |
0.003 |
98.0 |
84.4 |
| MET23-12 | 222 |
9.7 |
0.72 |
0.005 |
98.6 |
91.3 |
| MET23-13 | 316 |
14.6 |
0.52 |
0.001 |
88.6 |
14.6 |
| MET23-14 | 280 |
18.1 |
0.45 |
0.001 |
95.8 |
45.9 |
| MET23-15 | 283 |
13.1 |
0.69 |
0.001 |
98.0 |
57.5 |
| Variability Sample Average | 304 |
10.0 |
0.55 |
0.006 |
94.3 |
65.9 |
| Sulphide Master Composite | 210 |
10.5 |
0.52 |
0.007 |
96.0 |
93.2 |
| CPF Composite | 372 |
8.3 |
0.68 |
0.004 |
95.8 |
77.1 |
Open circuit cleaner flotation tests were completed on the sulphide variability samples using low dosages of PAX. Copper concentrate grades were consistently high, averaging 30.5% copper. Cleaner circuit copper recoveries are expected to average 98%, based on locked cycle test results. Cleaner circuit molybdenum recoveries are similarly expected to range between 86% to 92% for feed grades above 0.003% molybdenum.
Coarse Grind and CPF Performance Overview
CPF is a technique that combines the upward flow of a hydrosizer with flotation bubbles to recover coarse mineralized particles that would otherwise report to tailings in conventional froth flotation. It is applied in a scavenging application on rougher flotation tails that have passed through hydrocyclone size separation to remove lower grade fine material. The coarse material enters a Hydrofloat cell which recovers a coarse scavenger concentrate. The thickened underflow, depleted of any fines, is essentially free-draining and can be dewatered using a low energy system such as a sieve bend screen or a high-capacity belt filter.
Three bulk rougher flotation tests were conducted on a sulphide CPF composite at primary grind sizes ranging from 350 µm to 450 µm. Results are presented in Table 5.
Table 5: CPF Results
CPF Test |
Primary Grind (µm) |
Copper Recovery (%) |
% of Rougher Tails to Hydrofloat Tails |
||
Conventional Rougher |
Hydrofloat Contribution |
Net Rougher |
|||
P1 |
356 |
94.9 |
2.5 |
97.4 |
42.4 |
P2 |
445 |
93.4 |
2.8 |
96.2 |
45.3 |
P3 |
431 |
92.6 |
3.3 |
95.9 |
44.1 |
Note: After recovering 93%-95% of the feed copper to a rougher concentrate, the rougher tails were classified such that approximately 50% of the mass reported to a +150 µm fraction with elevated copper levels. These coarse tails were then treated in a laboratory Hydrofloat cell that recovered approximately 60% of the copper and molybdenum in the CPF feed to a concentrate containing about 12% of the feed mass.
The CPF concentrate requires regrinding prior to returning to the rougher feed or similar conventional flotation stage. A simplified flowsheet incorporating CPF is presented in Figure 1.
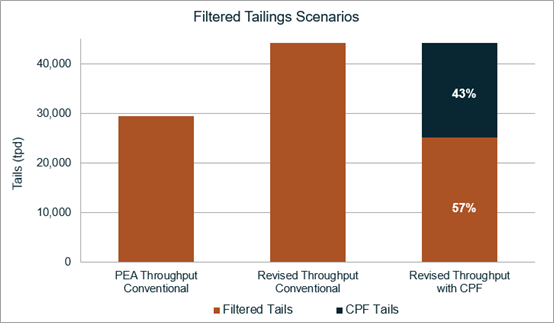
CPF performance confirms that a coarser grind does not compromise copper recoveries. Applying CPF scavenging on the rougher tails of a 350 µm primary grind appears to return the same overall rougher circuit copper recovery as a conventional flotation circuit with a 200 µm primary grind as proposed in the PEA. Additional grinding energy is only applied to a targeted 6% of the feed mass returning as CPF concentrate. While the incremental copper recovery improvement is modest, a significant benefit of the CPF circuit is removing tonnage from the tailings filtration circuit. In this arrangement, only about 57% of the total mill tailings reports to the thickening and filtration circuit. The tailings processing opportunity of this flowsheet is presented graphically in Figure 2. Preliminary results suggest that a CPF circuit could potentially allow for an increase in throughput to 45 ktpd without increasing the tailings filtration requirements.
Figure 1: Potential Coarse Grind Flowsheet
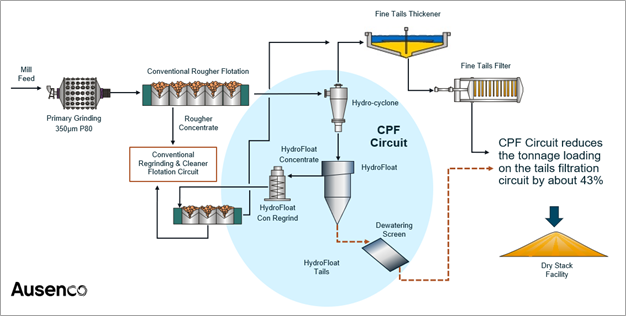
Figure 2: Tailings Processing Comparison between Conventional Floatation and CPF Addition
Flotation Performance - Transition Variability
Flotation testing on the transitional material variability samples supports the current understanding of copper recovery as a function of feed mineralogy. Metallurgical performance was generally better on these three samples compared to those tested in Phase I for the PEA design basis, however the average copper mineral assemblage was similar to the estimate used for the PEA. Metallurgical data is presented in Table 6.
Table 6: Transition Metallurgical Data
Metallurgical Details |
Copper Knight |
Copper Prince |
Copper Giant |
|
MET23-04 |
MET23-05 |
MET23-06 |
||
Copper deportment (%) in feed by mineral type |
Chalcopyrite/Bornite | 68.2 |
37.7 |
19.6 |
| Chalcocite/Covellite | 5.4 |
47.2 |
53.7 |
|
| Malachite/Azurite | 0.7 |
0.1 |
11.8 |
|
| Cu-FeOx | 22.4 |
11.7 |
9.4 |
|
| Cu Silicates | 3.2 |
3.2 |
5.6 |
|
Processing Details |
Primary Grind (µm) | 145 |
157 |
153 |
| Sulphidization Applied | No |
Yes |
Yes |
|
| Post Sulphidization Cu Recovery (%) | - |
4.1 |
22.9 |
|
| Regrind | Yes |
No |
No |
|
| Cleaner Stages | 3 |
1 |
Not Required |
|
Metallurgical Performance |
Cu Feed Grade (%) | 0.67 |
0.85 |
2.25 |
| Cu Recovery (%) | 65.1 |
81.5 |
82.0 |
|
| Concentrate Grade Cu (%) | 25.8 |
29.7 |
32.8 |
|
Concentrate Quality
Final bulk concentrates were assayed for minor elements of interest. Results are presented in Table 7. Two of the sulphide variability samples produced concentrates that contained sufficient molybdenum levels to support the inclusion of a copper-molybdenum separation circuit. Gold contents in the concentrates were above minimum payable levels on average. Silver contents varied and were significant in some samples. All arsenic contents were well below penalty level limits.
Table 7: Concentrate Quality of Variability Samples
Material |
Met ID |
Assay (%) |
Assay (g/t) |
|||
Cu |
Mo |
As |
Au |
Ag |
||
Sulphide |
MET23-07 |
29.1 |
0.090 |
0.006 |
1.4 |
18 |
MET23-08 |
31.9 |
0.050 |
0.008 |
1.9 |
32 |
|
MET23-09 |
36.1 |
0.760 |
0.023 |
4.9 |
142 |
|
MET23-10 |
35.2 |
2.15 |
0.003 |
3.6 |
80 |
|
MET23-11 |
47.7 |
0.250 |
0.002 |
8.8 |
310 |
|
MET23-12 |
33.4 |
0.160 |
0.023 |
1.5 |
240 |
|
MET23-13 |
25.2 |
0.002 |
0.071 |
1.8 |
96 |
|
MET23-14 |
23.9 |
0.015 |
0.006 |
0.7 |
52 |
|
MET23-15 |
32.1 |
0.027 |
0.130 |
0.1 |
28 |
|
MC LCT |
31.2 |
0.331 |
0.039 |
2.1 |
88 |
|
Transition |
MET23-04 |
25.8 |
0.033 |
0.014 |
1.2 |
58 |
MET23-05 |
29.7 |
0.365 |
0.013 |
0.8 |
53 |
|
MET23-06 |
32.8 |
0.135 |
0.013 |
3.9 |
38 |
|
Oxide Leach Performance - Column Leach Testing
Historical test work on leach performance was limited with only two instances where copper recovery from oxide materials was investigated. The oxide recoveries considered in the PEA were based on assumptions informed by limited information and therefore the subsequent metallurgical test work included more comprehensive column leach testing from various oxide sources.
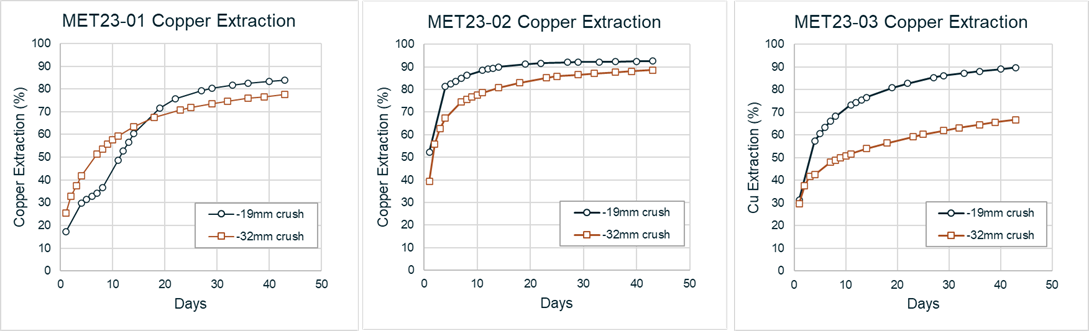
Three samples of ½ HQ drill core were provided for leach testing. The samples represent near-surface mineralization from three different pit areas. The samples were coarse crushed to minus 32mm, riffle split and sub-samples were further crushed as required.
Two 10 kg test column leach test charges were prepared for each sample, crushed to top sizes of 32 or 19mm. Each test charge was agglomerated with a sulphuric acid cure solution and the columns were then irrigated for 6 weeks (43 days) with a dilute acid solution (5 g/L). Summarized metallurgical results are presented in Table 8 and leach extraction curves are presented graphically in Figure 3.
The copper leach performance on these three samples shows considerable improvement over the estimates used in the PEA design. Most notable is that the net sulphuric acid consumptions are considerably lower than the PEA assumption.
Table 8: Column Leach Results
| Metallurgical Parameter | White Bear |
Copper Knight |
Hilltop |
PEA |
|||
MET23-01 |
MET23-02 |
MET23-03 |
Design Assumption |
||||
| Crush Size | -19mm |
-32mm |
-19mm |
-32mm |
-19mm |
-32mm |
-17mm |
| Leach days | 43 |
43 |
43 |
43 |
43 |
43 |
60 |
| Feed Copper (%) | 0.81 |
0.69 |
0.32 |
0.20 |
0.23 |
0.22 |
0.29 |
| Cu Extraction (%) | 83.8 |
77.7 |
92.5 |
88.5 |
89.8 |
66.8 |
75.0 |
| Acid Cure (kg/t) | 20 |
20 |
15 |
15 |
15 |
15 |
- |
| Net Acid Consumption (kg/t) | 11.6 |
12.8 |
4.9 |
3.4 |
10.5 |
10.8 |
20.0 |
Copper extractions exceeded 80% at the -19mm crush size. Only MET23-03 showed performance sensitivity to crush size. MET23-01 kinetics were somewhat hindered initially due to low acid conditions.
Figure 3: Column Leach Extraction Curves
Precious Metal Deportment Assessment
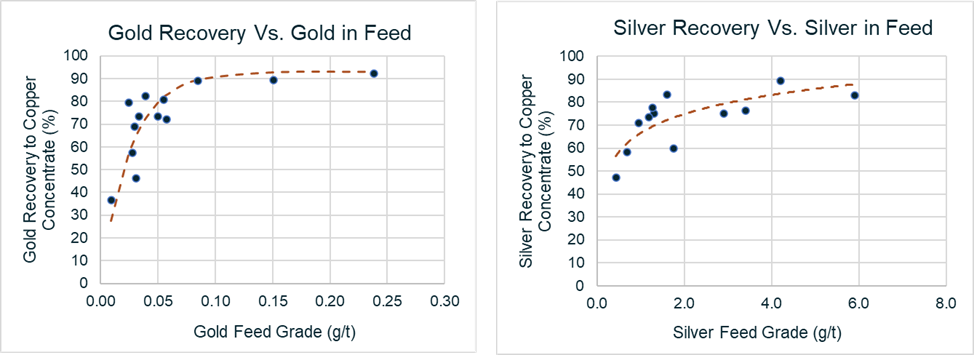
In parallel with the gold assay program (refer to news release dated October 5, 2023), the metallurgical program included an assessment on gold deportment to concentrate. Gold recoveries to variability cleaner concentrates ranged from 37% to 92%, and locked cycle testing on the sulphide master composite measured 73% gold recovery to final copper concentrate. Results suggest that a gold recovery to final concentrate of 75% can be expected at feed grades of 0.05 g/t gold.
Gold grades in concentrate are dependent on the copper:gold ratio in the feed. The results on variability samples suggest that at average feed grades of 0.44% copper and concentrate mass recoveries of 1.4%, feed grades of 0.05 g/t gold would result in copper concentrates containing approximately 2.9 g/t gold.
Silver recoveries from variability samples were also tested as part of this program. Results indicate a silver recovery of 75% from feed grades of 2g/t silver. Metallurgical test work suggests similar performance for both gold and silver.
Results for gold and silver deportment on variability samples are shown graphically in Figure 4.
Figure 4: Gold and Silver Recovery
Mineralogy Overview
Mineralogical composition assessments were completed on the variability samples by QEMSCAN. The results provide valuable confirmation of core logging interpretation and are consistent with geochemical assay results. The copper deportment data helps in understanding metallurgical performance. Copper deportment to mineral forms is presented graphically in Figure 5.
Figure 5: Copper Deportment by Mineral Form
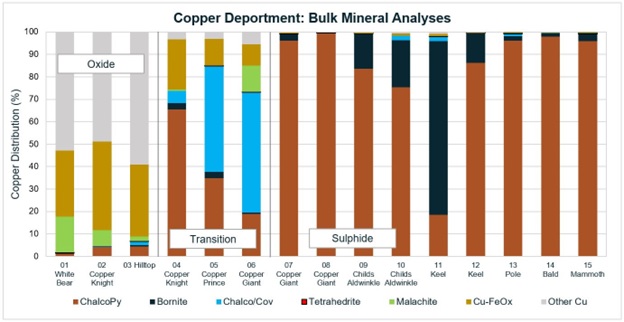
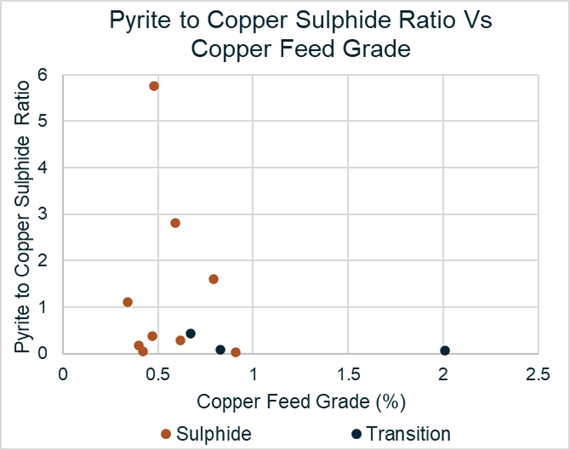
The ratio of pyrite to copper sulphides can be an important processing parameter, as values below three tend to have lower regrinding energy requirements and positive implications on metallurgical performance. The pyrite to copper sulphide ratios of variability samples are displayed graphically in Figure 6 relative to copper feed grade. Generally, the material is low in pyrite content, only the Bald sample had somewhat elevated pyrite levels.
Figure 6: Ratio of Pyrite to Copper Sulphides - Variability Samples
A more detailed PMA was conducted on the sulphide master composite at a primary grind sizing of 209 µm. The liberation characteristics were favorable, which supports the metallurgical performance measured by conventional flotation. Specifically:
- The size distribution of the copper sulphide grains was coarse, measured at 80% passing 142 µm. Although the overall copper sulphide mineral liberation was approximately 53%, about 80% of the mineral mass was in grains which contained 50% or more copper sulphide mineral. The high quality of the grains allows for successful bubble attachment in froth flotation.
A similar PMA was conducted on fractions the CPF composite at a primary grind sizing of 295 µm. The liberation characteristics did not appear to decrease significantly. About 75% of the copper sulphide mineral mass was in grains which contained 50% or more copper sulphide mineral.
End Notes
1 The Preliminary Economic Assessment was reported in a technical report titled "Copper Creek Project NI 43-101 Technical Report and Preliminary Economic Assessment" with an effective date of May 3, 2023 available on the Company's website at www.faradaycopper.com and on the Company's SEDAR+ profile at www.sedarplus.ca.
2 Rougher recovery refers to the percentage of valuable minerals recovered in the initial or primary stage of the flotation process.
3 Refers to grind size of 350 µm P80 applied to the sulphide composite, compared to 190 µm P80 utilized in the PEA. Grind sizes stated throughout this news release refer to 80% passing ("P80") the specified particle size.
SOURCE: Faraday Copper Corp.
View the original press release on accesswire.com


